Oct 26 2010
Another Look At The GOP Wave In The Early Voting
Update: Sean Trende at RCP does a similar form of analysis, gets similar answer.
Update: Those not seeing the wave are blinded by denial – so says The Hill. And The Hotline concurs.
Update: Read the analysis and then come back and check out this Hillbuzz rumor about moderate Democrats energized to vote straight GOP in protest. This is the nightmare scenario, where the Dems lose just about all.
– end update
Lots of conflicting stories out there regarding the early voting trends and what they could mean. The complexities with early voting are due to the fact they are a small sample in many cases, and may not accurately represent the final party vote when all is said and done. This data has some limits, but it is not useless.
One thing you can do with the data is determine which group is performing above their registration levels. Voter registration reflects the overall state party affiliation, therefore comparing which political group is out voting early compared registration is a good indication of who may be energized and who is not. This is the enthusiasm gap we hear so much about.
A second thing you can do with early voting tallies is treat them as an approximate turnout model for the election. We can run scenarios through the early voter turnout statistics based on expected (or polled) preferences for each party. For example, Gallup is showing in all their generic voter models what I call a 60-40/95 model, wherein the GOP and Dems each garner ~95% of their party voters and the GOP has a 20% lead (60-40) amongst independent and 3rd party voters. Running this through model through early voting percentages produces a theoretical count of votes cast in early voting. Gallup’s 60-40 GOP lead with independents is the independent gap we hear so much about.
But here’s the rub. I don’t think Democrats are holding their base that well. I think there is a schism between the liberal far left and the moderate, center left. I think Democrats are going to be losing a significant number of their base this year. I don’t think you can lead with 20% of the independents and not pull at least 15% of the Democrat left-of-center voters. So I have decided to run another test, the 60-40/D:85 scenario to see what the vote results in early voting would be like if, as I suspect, there is a significant Democrat defection rate (something we hear nothing about). Here I assume the GOP hold 95% of their party voters, but the Democrats only hold 85%.
So this analysis covers the enthusiasm gap (who is voting above or below their registration levels), what the impact of the GOP lead on independents would mean in terms of early votes cast, and what would the result be if the Dems are also losing 15% of their party voters to defection.
Summary Results:
As we look across the three years of partisan registration data for each state one thing stands out – there is not a lot of movement towards the GOP registration-wise. This is not a surprise, since this election is driven by a rejection of the Democrats, not by any attraction to the GOP.
Most sates show some edge in enthusiasm to the GOP. When using the Gallup 60-40/95 test scenario the GOP wins the theoretical early vote numbers in most states. In those states which show Democrat enthusiasm or simply larger numbers of registered voters, a small 10% defection rate (the 60-40/D:85 scenario) can turn a blue state red (theoretically).
There is an clear GOP enthusiasm edge in the early voting data. When combined with the GOP lead with independent voters (Gallup has measured all month for the GOP) the GOP wins nearly all the early vote contests. But if there are also significant Democrat party defections on top of the enthusiasm and independent gaps, then some ‘swing states’ (like FL and PA) become absolutely toxic to Democrats.
Finally, early voting trends are proving to be very static over time. I have tracked some states daily, and once a percentage is set for one group of voters never really changes. That means the voter intentions are locked in and set already. Whatever the real enthusiasm gap, edge with independents and depth of Democrat defections – this race is set in stone through election day.
Detailed Analysis
So here is my updated detailed analysis of the early voting trends – comparing early voter turnout to registered voter levels in 9 states (previous version here). I added the voter registration levels for 2006 and 2008 to the charts since they were graciously provided in this Politico analysis. Much of the early voting data was found at this site at GMU, and this site for NC. State 2010 registration data are linked for each state. You can click all images to enlarge.
Colorado:
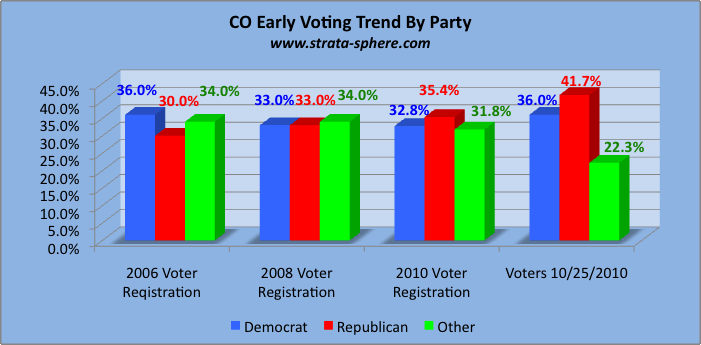
While Democrats are out voting above their 2010 registration ceiling by +4%, the GOP early voters are running +6%. In other words, a GOP ‘registered voter’ lead of just under 3% turns into a GOP early voter lead of 5%. In tight races 5% makes a big difference!
Now let’s look at the two test scenarios. If we assume Gallup’s 60-40/95 model then the Dem’s GOTV effort is falling way short. This is because the combined GOP & “Other” percentage dwarfs the Democrat’s measly 36% of early voters. Under the 60-40/95 model the Dems are losing the theoretical early votes by 9.5% (58.4-45.2).
Under the 60-40/D:85 model it is a blow out. In that case, where Dems lose not 5% of their base but 15% (not a lot), then the GOP wins by 16.8% (58.4-41.6)! This is what the Dems fear, the trifecta of lower enthusiasm, rejection by independents and defection by moderate dems. This why statewide races for the Senate and Governor are even in play.
Florida:
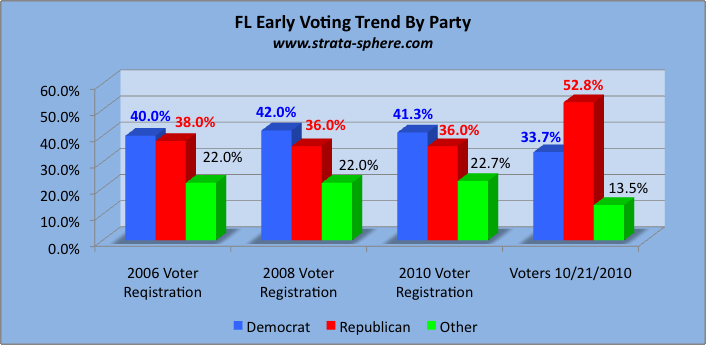
Florida is going to be a disaster for Democrats next Tuesday if early voting is even close to the final turnout data. Here the Democrats are running almost 8% points below their registration level, while the GOP is running 17% above theirs. In registered voters the Dems lead by 5%, but in early voting they are lagging by 19%.
Under the 60-40/95 Gallup model, where each party holds its partisans, the Dem lose theoretical early voting by a stunning 19.9% (59.9-40.1). If, as I suspect, the Dems are not able to hold their base and lose 15% in crossover votes, then situation in FL is completely toxic to democrats, as they lose the state by 26.6% (63.3 – 36.7). Heaven help Dems in Florida this year, no recounts will be necessary.
Iowa:
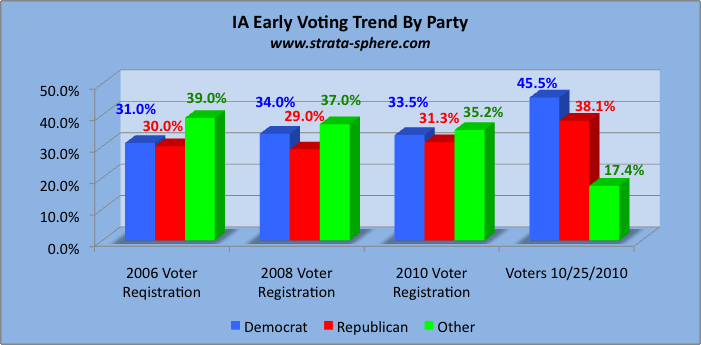
Iowa is a great example of why you cannot go by early voter percentages alone. There are no Iowa Republican candidates in trouble as far as I know, yet look at how the Iowa dems are rocking the early vote! They are 12% above their registration level and 7% above the GOP early voters. This is one of those examples used by math challenged liberals and journalism majors to claim a Democrat edge in early voting. The GOP is looking good here with a +7% on their registration level, but the Dems voters should be expected to swamp the GOP. If only that were how it will play out.
If we use the Gallup 60-40/95 model the Dems lead the state by 3.3% (48.2-51.7). But we know there are few if any endangered GOP candidates here, so the only answer is the Dems are losing more than 5% of their voters in Iowa. So we turn to the 60-40/D:85 scenario and find the GOP wins Iowa by a comfortable 5.8% (53-47.2). Granted, each state will have a unique crossover vote pattern, but I think Iowa is the example that proves where the final mass of the tsunami lies. After voter enthusiasm and after the gap of independents comes the democrat party defections. I just don’t see the Gallup 95 model holding up this year.
Louisiana:
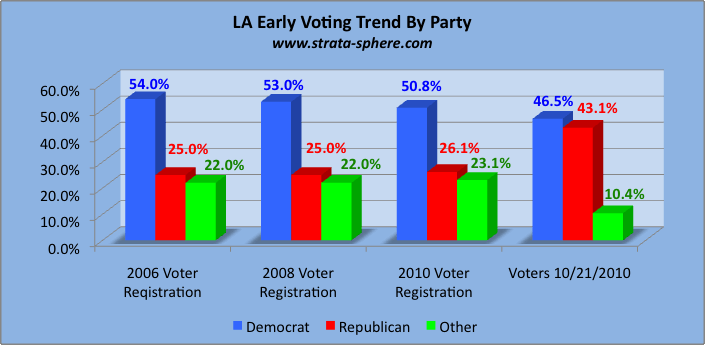
What I love about this analysis is seeing how each state is unique and responds uniquely to the 2010 wave. LA has an enormous Democrat lead in voter registration (+24.7% over the GOP). But in Early voting that massive lead has disappeared down to 2.4%. The Dems are down 5% off their registration levels and the GOP is up 17% above theirs. There is no mistaking the GOP enthusiasm edge in LA.
How this may be reflected in votes is also interesting. The 60-40/95 scenario produces a 50-50 tie! Is Senator Vitter in a close race? No he is not. Are GOP candidates in trouble? Except Rep Cao in LA2 the answer is no. So clearly the Dems will not hold 95% of their voters in LA. The 60-40/D:85 model confirms this, showing a GOP win of 9.2% (54.6-45.4) in LA under these conditions.
Like Iowa, LA indicates the 2010 wave will be a combination of low enthusiasm for Dems, the loss of independents and moderate democrat defections. I don’t think pollsters have all these effects rolled into their turnout models yet.
Maine:
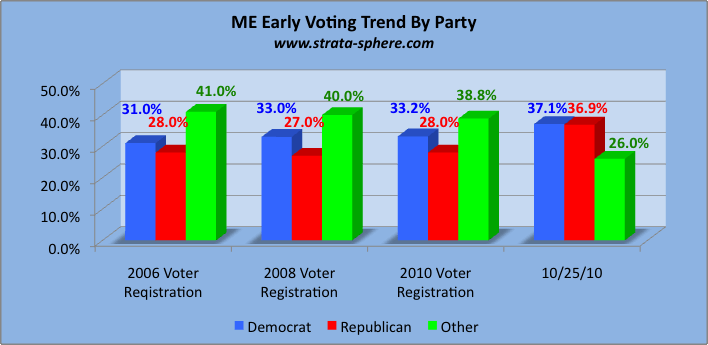
Maine is one of those states dominated by independents. Here the Dems can win by overpowering the GOP voters and offsetting any lead with the “other” voters. That would be the case if the voters came out close to their registration levels, where the Dems hold a 5% lead over the GOP. But in early voting this cycle the Dems, while garnering a few more voters, are losing the overall numbers game. Being on parity with the GOP on voters coming out will not do the job while the GOP takes the majority of the “other” voters.
In the 60-40/95 case the GOP wins Maine by 5% (52.5-47.4). But if you want to know why congressional Democrats from Maine are not sleeping well these days, it is because a 60-40/D:85 scenario boosts the GOP to a +12.4% lead (56.2-43.8). This is how the gap of independents, where the GOP is running 20% ahead, comes into play and wreaks havoc on Congressional dems.
North Carolina:
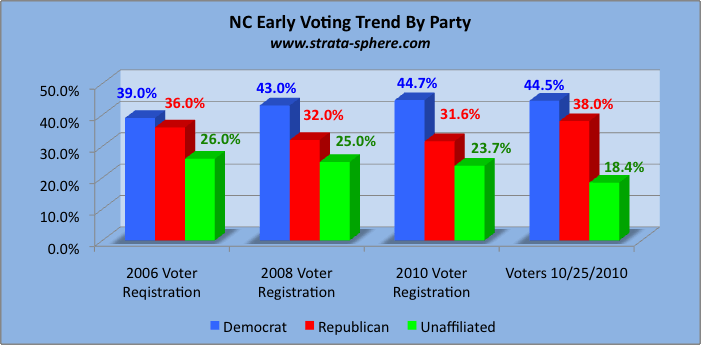
North Carolina is another state that starts out with a huge registration edge for the Dems over the GOP with +13%. In early voting there are no indications of Democrat enthusiasm, as their early voters are right in line with their registered voter levels. The GOP, on the other hand, is up +8% in early voters relative to their registered voters. Here, defection is everything in terms of Democrat chances.
In the 60-40/95 model from Gallup Generic, Dems eek out a 2.5% win here in theoretical votes (48.8-51.2). But as with previous examples in LA and IA, I am not aware of a blue wave hitting NC this year. The 60-40/D:85 model gives the GOP a modest 6.4% win in theoretical early votes (53.2-46.8). But I think NC will see even higher defections than that come election day, so I consider this a floor and not a ceiling.
New Jersey:
One of the new states I was able to add because of the data in that Politico piece referenced above was NJ. Voter registration over the years is very interesting to see in NJ, as independents apparently moved to the Democrats from 2006 to 2010. But NJ is home to the now infamous 2009 GOP mini-tsunami which put GOP governors in NJ and VA. That wave later traveled to MA in January of 2010 and seated Scott Brown in the “Kennedy” Senate seat. One could argue NJ and VA were the first to be hit by the voter backlash now cresting towards next Tuesday.
The 2009 NJ win came with the Democrats holding a 13% registration lead over the GOP. But it was the 13% lead of the “other” independent voters over Democrats which pushed Christie to his big win. It can happen again in 2010. Early voting has the Dems 10% above their registration levels and the GOP up 8%. Here could be argued a case for Democrat intensity. They are overcoming the enthusiasm gap and the gap of independents. But will the “other” sit home??
In the 60-40/85 theoretical model the Dems win NJ by 7.7% (46.2-53.9). The 60-40/D:85 test brings the GOP to a very slight edge of +0.9% (50.5-49.6). Again, if the Dems lose even 10% of their voters, a large lead just evaporates.
Because the NJ early voting numbers look so skewed in terms of the dominant political group (other), I added a unique 60-40/D:85 test for NJ. I wondered what that would look like if assume the final percentages were in line with 2004 registration levels (simply assume the 2010 actual voters looked like the 2004 registered voters). In that case the GOP jumps out to a theoretical 6.2% lead – not far off from Christie’s win percentage last fall.
Nevada:
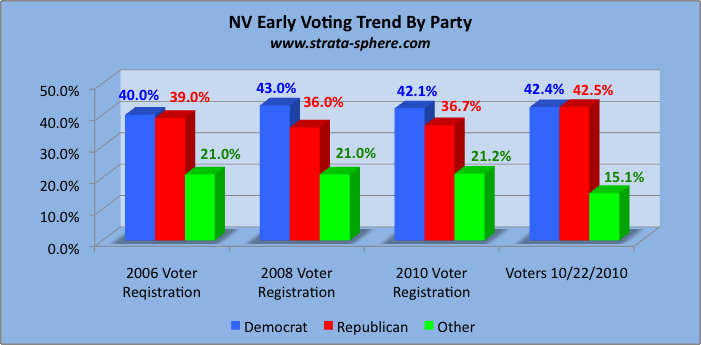
The home state of soon-to-be-retired Senate Majority Leader Reid. Again we seem Democrats holding to their 2010 registration levels in the early voting pool, while the GOP is up 6% above theirs. A Democrat 4.4% lead in registered voters is all gone in the early voter numbers – in a record turnout year for Nevada. This clearly will not help Reid.
Under the 60-40/95 model Harry Reid would be losing the theoretical vote total by 3.1% (51.5-48.5). But with some Dem defections it becomes a blow out. Under the 60-40/D:85 model the GOP jumps to a 11.6% lead in theoretical votes (55.8-44.2). I would wager Angle’s win over Reid next Tuesday will fall withing these two scenarios.
Pennsylvania:
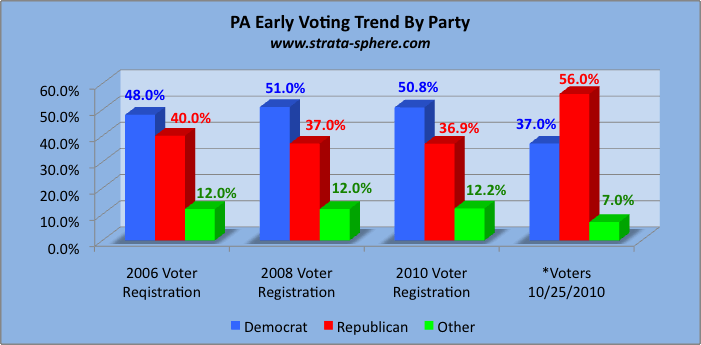
This is also a new state I was able to assess thanks to Politico. The Dems enjoy a hueg registered voter lead in PA, up 14% over the GOP. But we know from recent polls that PA is a place very hostile to Democrats this year, but not attracted to the GOP. Only recently have the statewide races tipped to the GOP (see here for Toomey’s sprint away from Sestak). Early voting indicates why there is such a Dem wipe out in the making – look at the enthusiasm gap! That 14% registration lead is turned into a 19% early voter deficit for the Dems.
Turning to the Gallup 60-40/95 model the GOP wins PA by an incredible 18.5% (59.3-40.8). The 60-40/D:85 model is of course even worse, showing a 25.9% GOP lead in theoretical early votes (63-37.1). This data reflects an early and small sample, so I would not put a dime on its accuracy. But I have to re-emphasize these early voter percentages don’t move much after the first set of data come out. Even shaving the Gallup 60-40/95 model back by 50% represents a GOP wave so big there may not be any congressional Dems left standing.
There is a huge wave out there.




[…] This post was mentioned on Twitter by Chattertrap, Free To Prosper. Free To Prosper said: Another Look At The GOP Wave In The Early Voting http://bit.ly/cgTBd7 :: Strata-sphere […]
Let the party switching begin…
I predict there will be at least one or two party switchers in the House after the 2010 election is over (it’s never fun being in the minority after all).
So who do you think will make the switch? James Webb? Don’t think he liked Obama that much, didn’t he?
I do not like James Webb. Who else?
Question: Can the new Congress restore the government? Perhaps this article answers it as a historical example until they made a mistake.
http://www.nationalreview.com/articles/251106/midterm-election-restored-america-arthur-herman – by Arthur Herman (remember the Galula Plan?)
It’s going to be very easy for the new Congress to make a serious mistake and Obama and his Dems will jump on that really fast.
Will that backfire on Obama and the Dems? I wouldn’t be surprised if it did.
Did you read Sean Trende’s article from this morning?
[…] news for the rest of us, at least when it comes to medical care. Let us hope, therefore, that AJ Strata is right about the wave, because we need a countervailing tsunami to stop the wave Obama and the Democrats […]
Lurker9876:
On the Senate side: Manchin (if elected)?
See this from James Taranto in the WSJ:
Most Likely to Secede:
Which Democratic senator will turn Republican? Probably not Joe Lieberman or Ben Nelson.
AJ,
Iowa is unique this year. There is an initiative by the Repub whose lost the Governors primary to remove three supreme court judges for basically ruling that gay marriage was allowed by Ia law.
The drive by the loser Repub is to vote out the judges and I am sure this has the dems all fired up.
I would bet that is driving Dem turnout but I would also bet a bunch of them are voting R as was my experience yesterday with two seasoned citizens who are pissed off at the prospects of paying more for worse medical and no SSI increase. That little increase is a huge deal to almost every seasoned citizen.
It seems that polling analysts like Sean Trende have finally twigged to the implications of the “Under Served Right” — AKA Marginal Republican Voters” — showing up in the 2010 mid-terms, thanks to the Tea Party:
http://www.realclearpolitics.com/articles/2010/10/27/what_to_make_of_early_voting_107747.html
Democrats probably came pretty close to maxing out their marginal voters in 2008, and President Obama is working hard to get them to turn out again. As Cost points out, this is why Obama is wrapping up the campaign in Rhode Island and California. If he can turn out marginal Democratic voters in key blue states, it might help to shore up vulnerable Democrats like Barbara Boxer or Jim Costa in CA-20.
But the big question is how many marginal Republican voters will be in the electorate this year. Anecdotal evidence suggests that Republicans are extremely fired up this year, and that may explain why GOP participation in early voting in North Carolina and Florida is outstripping even 2004 turnout.
But odds are that marginal voters in both parties won’t turn out until Election Day. It is also worth noting that these GOP voters would not be counted in any likely voter screens, which frequently keep out voters who haven’t voted in the last two elections. This is especially true of state-level polls, where pollsters frequently don’t have the resources to conduct in depth voter screens. If marginal Republican voters don’t turn out en masse, the Democrats might avert catastrophe. If they do, Democrats will need to batten down the hatches.
This is why Obama’s racial appeals to his Democrat marginal base voters and have been so counter productive this election cycle. For every marginal Democrat his appeals too, he is activating more than one Republican marginal voter.
Given the distribution of Democrats, Obama is making the 2010 Republican Tsunami worse for House Democrats outside the Gentry class university towns and majority-minority urban areas and for Democratic Senators.
We are looking at 80-100 Republican House seats picked up and 10-12 Republican Senate seats.
Your 60-40 test is reasonable but the Gallup poll is national. When doing detailed testing in each state you should use the generic poll for that state. It may be 60-40 in Maine but only 55-45 in Florida. Also, Dems may get 95% of party vote in Maine but only 75% in Florida.
Need better state specific polling to accurately predict the election.
The Scott Brown race is a good example. In states with low R’s and high D’s with high I’s the vote totals may be higher for D’s, around 30% and I’s 65-70%.
In states like CO where the registration is rather even. The Dem loyalty may be high around 90-95% and the “I” may only be 10%. It changes the analysis by only 2%, but it keeps it closer.
that is one impressive piece of work, AJ! Texas early voting is running about 50% ahead of the levels in the last midterm elections, although I haven’t seen any partisan breakdowns yet. (Texas voter registration doesn’t designate a party unless you vote in a primary, so it may be hard to ascertain)
As of yesterday, 1,125,673 early votes had been cast in Texas, 13.5% of all registered voters in the State.
http://www.sos.state.tx.us/elections/earlyvoting/2010/oct26.shtml
MarkN,
Actually I am not into predicting the final numbers to the tenth of a percent – precision without purpose. What I am testing is how sensitive the state is to scenarios. All the states I tested would go to the GOP with a small defection rate from the Dems.
Which means I can predict who wins easily – by how much I don’t really care!
Polls are getting funky. Susa has Boxer leading I’s by three and CNN has Fiorina leading I’s by eight.
Both has Boxer ahead by five. CNN has a D+14 sample, SUSA has a D+9 sample.
If the election is D+4 or less …..???? Carly comes out with 50%.
[…] As I have done before, I can run two scenarios through these early voter numbers and estimate the GOP and Dem votes produced. The first model is the 60-40/95 scenario where each party holds 95% of its party’s voters, but the GOP take the independents by 20% (60-40). If that is how these voters voted, then the GOP would win by almost 16% (57.9%-42.1%). […]