Oct 25 2012
Poll Trends: Obama Fades As Romney Rises
When I look at polls-of-polls that throw everything into the ‘snapshot’, or ridiculously precise models using data that has enormous error bars, I am reminded( as any good aerospace engineer is) that precision is not always a sound goal. It is at times more important (and defensible) to understand trends and envelopes and not waste time on mythical precision. How well I think I can nail a number within in +/- Margin of Error (MoE) of 3% or greater (some like Nate Silver think he can get this down to a 0.1%) is a waste of time. I would be chasing ghosts in the sample noise.
Understanding the dynamics of the system must come first, before you attempt precision. And in political polling, the dynamics of what is being sampled (the electorate) is very poorly understood.
By means of example, cutting edge statistical models are able to compute your position on Earth (or in orbit) with great precision because of two things:
- Large numbers of independent samples in a short time period (on the order of minutes) – e.g., GPS
- Well modeled dynamics for orbits – the system model required to turn samples into results.
Orbital dynamics are consistent and slow to change. This is why lots of samples from different angles using a space-based measurement stick (e.g., the RF signal from the GPS satellites) can resolve your position quickly and with real precision.
So, how does this form of statistical modeling compare to the art of political polling? Sadly, political polling is more like another complete shot-in-the-dark form of statistical modeling, along with exaggerated conclusions: Global Warming and Paleoclimatology. I wonder which has the more noise – tree rings or political polls?
These overblown statistical efforts ignore some basic rules for teasing precision from sampling:
- The sampling must have a high temporal density (i.e., lots of samples in a short time, even for low dynamic systems) to accurately capture the state (snapshot) of the system under measurement
- A consistent or well understood dynamic model that can be used to derive results from the samples (orbit trajectories versus party affiliation, partisan intensity, economic environment, personalities, etc)
- Independent sampling across the key drivers being measured.
When we compare a GPS position computation to polling, we see how these criteria are not met in the case of polling:
- Samples are sparse in time and scope. Only national polls sample daily, but then they miss aspects of the 3rd attribute – state level effects.
- The polls are based on historic turn out models – which are not steady or well understood. Unlike Keplerian Physics and orbital mechanics – which are immutable and stable – the electorate’s dynamics are complex. And in elections during hard times, these dynamics are completely unpredictable. Therefore, the poll MoEs are much larger than advertised (advertised MoEs are the statistical MoE, not the turnout model MoE).
- GPS works because the measurements are not just taken many times over minutes, but from many angles. If you use a single satellite measurement, the errors in your position cannot be resolved. It requires even sampling from many angles. This is clearly not accomplished in political polling.
So, what does all this mean? It means tenth of % precision is a sad joke, and it means the bottom lines across polls (polls of polls) are an attempt to combine numbers that have no business being combined.
That leaves us with one datum left to rely on: same-poll trends. Here we can POSSIBLY measure the trajectory of the race. Here, when we look at many polls at once, we satisfy the 3rd rule of statistical sampling (independent measurements). Below I selected 6 national polls (3 of which are daily samples) to do some analysis on the trend in the race. By using a mix of polls (daily for an attempt at high sampling) and weekly for an attempt at independent sampling) we can see if there is a trend.
And there is.
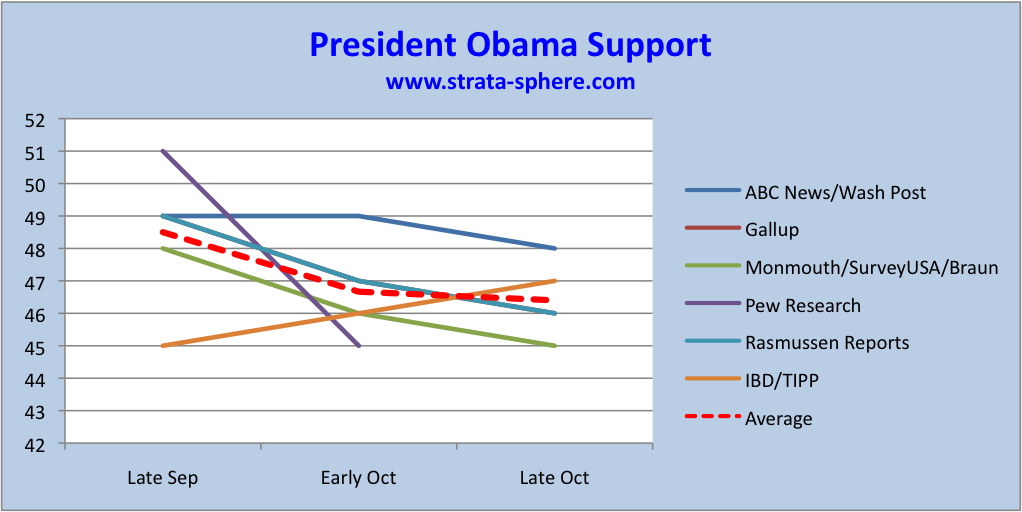
First, let’s look at the President’s numbers as the have been moving from Late September, to Early October and finally into Late October [click to enlarge).
If you look at the chart you will see the various polls as they flow over time, and the red dashed line showing the average. Five out of six show a downward trend. I just picked ones with consistent data over the time span, so I doubt the selection process is a driver. And these polls represent thousands of samples, so make of it as you wish.
From this we see the President slipping away from the magical 50% mark and losing about 3% points over this time eriod. Is it 3%? More or less. The point is he is losing support. Also, importantly, he is sitting (on average) at 46% now. As I have noted before, the gap between the two is not as important as the polling level across polls – especially for incumbent presidents!
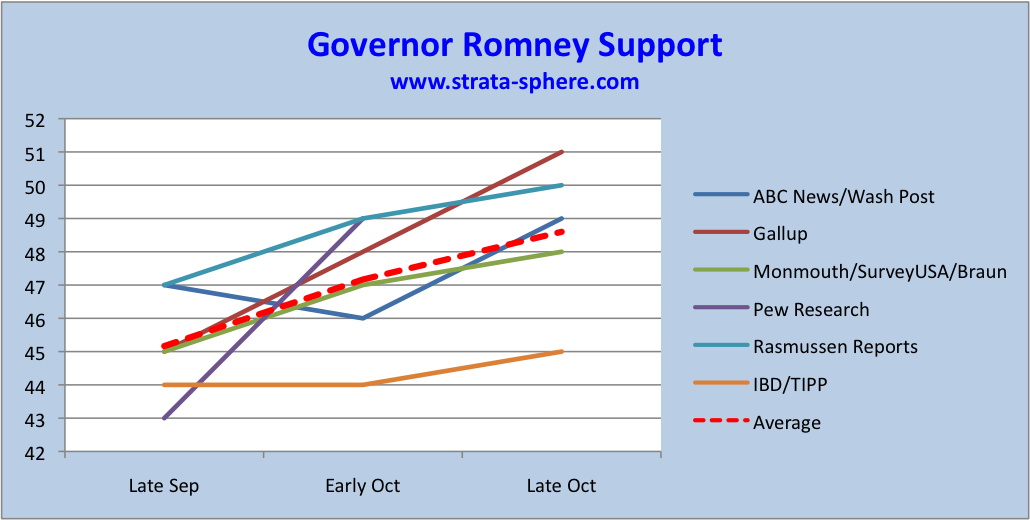
Now let’s look at Romney’s numbers.
Not surprising in a two-person race, Romney is rising as the President fades. Romney has gained 4% and is coming closer to the 50% mark (now sitting just under 49%). If these trends continue into November it is obvious were we are heading.
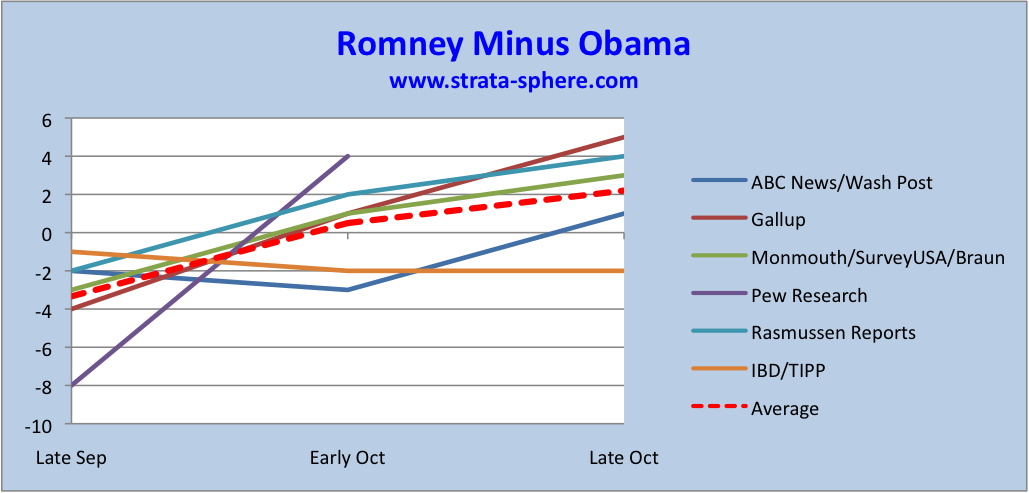
Finally, lets look at the gap between the two. This is Romney minus Obama, and it of course confirms the general trend seen in the other two charts:
Here we see the President did have an average lead of 4% and now trails on average by 2%. Again, I am not claiming the -4 or +2 for Romney are precise, I am just noting the trend confirms an ascending Romney. And this has been born out in the state polls as more and more states once blue turn toss up, and toss ups trend red.
The trajectory towards Romney definitely slowed down a bit from early to late October. And there will be a point where he hits his ceiling while the President hits his floor.
But as of now, the President does not look like he has a very good change of winning in November. Only more time and polls will tell for sure!
I hope to update these when Pew updates their numbers and next week right before the election.


The electoral college, according to Rasmussen, shows Romney 261 versus Obama 253. Close. Could be down to two states: Ohio and Iowa.
I think Ohio and Iowa will go Romney’s way but both teams are working hard in these two states.
What do you think?
Lurker,
I don’t think it will be at all close, but what do I know!
I fear the Democrat “ground game” in the in the cities, and their multi-level fraud network.
Hope for the best, but prepare for any result.
[…] wearing savior image Obama had four years ago. Again, the electoral map is a nail biter, but the momentum is on Romney’s side. Clive Crook has concluded Obama ceded the political center to Romney while Stanely Kurtz asks why […]
AJ, you do realize that these kids don’t learn about Significant Figures any longer, don’t you? 🙂
And it never was a concept well understood outside the engineering community.
There is one other problem that polling has that other statistical models don’t have: a GPS satellite can’t refuse to provide an answer. When pollsters report that 91% of those they call don’t cooperate (either don’t answer the phone or refuse to be polled) then it’s very hard to say with a straight face that the 9% who do answer accurately describe the whole population. It becomes analogous to saying everyone loves Lady Gaga because all the people at her concert said they did. Computing the answer out to 6 decimal points isn’t going to change the fact that your data is crap.
But of course, the early polls were never about accuracy, they were about narrative.
Polls drive me crazy. So, I’m glad we have some like AJ who will dive into them and try to paint an analytical picture for us. Bob Krumm has some interesting analysis also from the perspective of comparing 2008 to 2012:
A choice or a referendum?
http://www.bobkrumm.com/blog/?p=2445
AJ
“I don’t think it will be at all close, but what do I know!”
I agree, I think it’s going to be a Tea Party type turnout. I mean with states like Florida now going big toward Romney, they’re not the only state with good sense. Obama may be lucky to get 200 votes.
[…] AJStrata, a statistician who works with Global Positioning Systems, says it well. He cautions readers to be wary of “ridiculously precise models using data that has enormous error bars. Where Keplerian physics is well understood and can be modeled precisely enough that the incertitude of the samples [one] measures makes little difference to the outcome, in politics, “the dynamics of what is being sampled (the electorate) is very poorly understood.” […]
Being a woman I have two ways of looking at the presidential race.
One is emotionally. Here, for me, it is a nail-biter. I’m on a roller coaster of nerves.
The other is an intellectual analysis — looking at not only the polling trends, but also the enthusiasm. Here, I think it could be one of those republican waves, that washes across the country, surprising a lot of people.
People are murmuring the ‘silent majority’ meme, where the non-squeaky wheels turn up in force, at the polls, to register their objections and now disgust (with the Benghazi incident in full bloom).