Feb 14 2012
Argo Data Confirms El Niño/La Niña Caused By Underwater Volcanoes
A warm welcome to WUWT readers, and a huge thank you to Anthony Watts for making this a guest post at his site. Hope you find it all worth your time.
Last week I postulated that the El Niño/La Niña effect was not due to solar or atmospheric conditions, but actually caused by underwater volcanic activity along ocean ridges off the West coast of South America. To see whether my theory held water I decided to look into the Argo Float data to see if there it was showing a warm upwelling of water in this region. I apparently was correct.
My initial assessment was that the frigid Humbult Current that comes north from the Antarctic region along the west coast of South America (the mirror image of the current that drops down from the Arctic along the west coast of North America) could not be warmed so drastically in such a short time by sun and air alone. This is due to the physics of ocean currents and the massive amount of heat required to warm tons of cold water moving northward per second:
Gyres are caused by the Coriolis Effect; planetary vorticity along with horizontal and vertical friction, which determine the circulation patterns from the wind curl (torque).[1] The term gyre can be used to refer to any type of vortex in the air or the sea, even one that is man-made, but it is most commonly used in oceanography to refer to the major ocean systems.
…
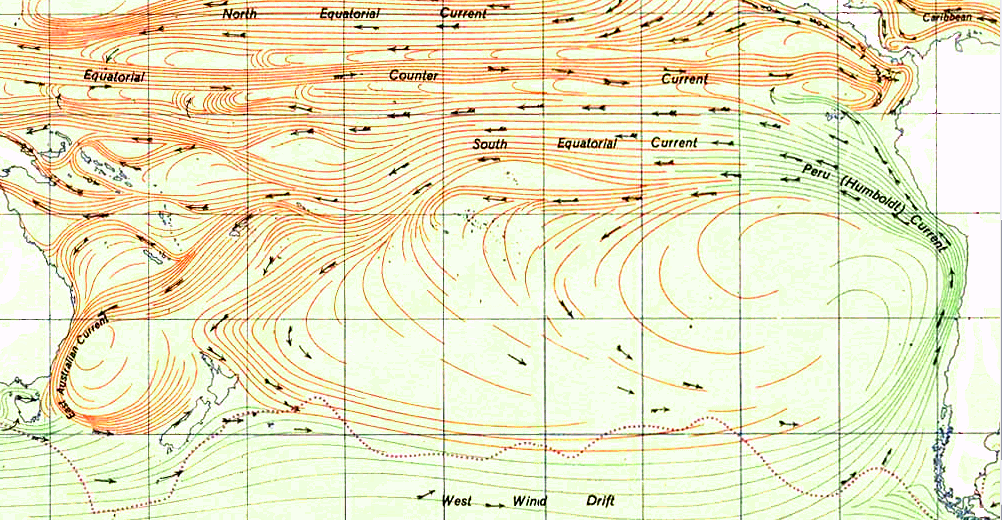
The “South Pacific Gyre” is the Earth’s biggest system of rotating ocean currents, bounded by equator to the north, Australia to the west, the Antarctic Circumpolar Current to the south, and South America to the east.
As can be seen in the graph above (click to enlarge), the Humbult Current is one of the largest on the planet. It is infeasible that El Niño can arise from atmosphere and sun alone by warming this mass of water. Neither air temp or solar radiance change enough to cause this phenomena.
At this site you can watch animation of nearly 5 years of Argo data on the tropical region of the Pacific Ocean. It is fascinating and proves my earlier conclusion that the warm waters of El Niño arise from the eastern pacific and travel west – not the reverse as is the current (now defunct) theory. You need to set the start date on the left to the earliest date in 2007 and the end date to the latest in 2012.
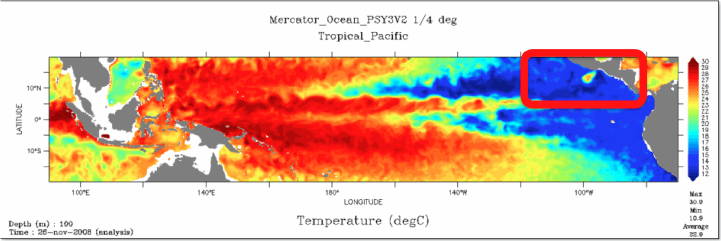
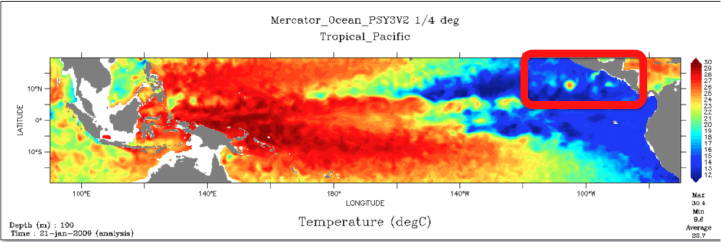
I suggest you first watch the surface animation, then go the the 100m data. What you will see in the 100m is hot water upwelling off the coast of Costa Rica (which was not in the zone I originally predicted the upwelling would occur BTW). I have taken a few snaps of the data from Oct 2008 to Feb 2009 at 4 week interval to highlight what I discovered.
On this first image (click to enlarge) we see the very beginnings of the upwelling off the coast of Central America (area highlighted by red rectangle with a small blue dot). As time progresses the upwelling grows, moves west and another upwelling appears. The images are from 10_22_2008, 11_26_2008, 12_24_2008, 1_21_2009 and 2_25_2009.
Now some may ask why didn’t Argos detect the upwelling deeper (1000m)? The answer is in fluid dynamics. The hot spot is very narrow above whatever thermal vents are the source of this warming. The Argo floats are not very dense in this region. So the warm column of water upwelling has to spread out as it rises, making it more likely to be detected by the Argos floats. By the time it hits the surface the warm water really spreads out over top of the cooler layers below.
As this March 2009 surface image shows there are two upwellings in the area, but the one off Costa Rica is missed at the lower depths (again likely due to the density of sensors being so low in this area). And there appears to be a 3rd upwelling off the coast of Peru.
The activity of Nicaragua and Costa Rica is right along the Cocos Plate. The Peruvian region I highlighted in the previous post and is linked to the Pacific Rise. Higher volcanic activity in these areas clearly cause more warm water to rise and heat the surface, creating the conditions for El Niño. Lower activity allows the cooler currents to dominate, bringing on La Niña.


This is a really surprising and innovative theory – I have not seen it from anyone else. I wonder if Anthony over at WUWT would publish this as a guest post? It deserves some widespread and serious consideration.
Specifically I’d like to know if there are any more conventional explanations for the narrow heat plume seen in the data. Does this location match with known subsea thermal and volcanic vents?
WWS,
I live outside the box. I dropped a hint link at WUWT, see what happens. And yes, there are unerwater ridges along plate boundaries exactly were the plumes arise.
That was my confirmation that the theory was likely to be correct. I am 95% confident now.
As a geologist, I find this really interesting. It correlates with discoveries under arctic ice (2008), which suggested possible melting and thinning of the ice sheet. More recently, studies in Antarctica suggest, similarly, volcanic action is responsible for glacial melting.
Although I’m an enthusiastic supporter of the space program, it seems to me money is better spent for more low tech Argo floats then expensive satellites to collect data.
granitroc,
Now your moniker makes sense! You might enjoy this post of mine from June 2008
BTW, Argo could not report its data without those satellites which sweep it up every day.
There is another massive data bank of ocean temperature profiles that exists that could be brought to work on this subject.
Both aerial and seaborne craft have for years dropped millions of probes into the ocean to determine temperature gradients and observe their probable effects on sound propagation for own ship sounds and sonar effectiveness.
For example it detects the important temperature layers that can help hide a submarine if they go below that depth.
The probes in general go straight down and measure temperatures al the way to the bottom.
MerlinOS2,
Point me in the right direction!
The animation is fantastic. the detail is remarkable. I know some will still dispute this as the cause of el nino, but how could anyone explain the ‘temperature swirls’ as being caused by atmospheric temperatures? very simply, they can’t.
good article..
Thanks Redteam.
I believe the old Chinese proverb is in play. Watch what you ask or, you just might get it. Clearly Argo and NPP were efforts to prove AGW, but they have done just the opposite. They have exposed untold insights and mysteries to us – none of which comport to the IPCC Chicken Little cries.
A. J.
You should put this information in a paper format and submit it to a respected academic journal that deals with oceanography or meteorology.
Discovering the cause of El Ninjo, if that is what you have done, is a significant scientific acheivement
[…] Argo Data Confirms El Niño/El Niña Caused By Underwater Volcanoes […]
Phil,
I hear you and would love to find the time to do it. But my day job (getting satellites on orbit) and my other day job (running a tiny aerospace company) has me booked at the moment. Tell you what, anyone want to do a joint endeavor I am all for.
If volcanic activity is the cause, why is the pattern so cyclical? Would the volcano ebb and flow like that?
grantbfs,
Think Yellowstone and Old Faithful (one of numerous cyclic geological events).
I think it is less a volcanic eruptions (rare, but cyclic) but more under water geysers. Probably a mix of the two, plus atmosphere and wind underlying this mechanism.
Maybee this solar systems gravity push and pull changes(planetar instabilty)gravital instability are responsible for both Solar changes and earth teknotinic changes?
Nice work sir.
There’s a huge amount of energy being pumped in by hydrovents AJ.
You may be interested in this paper:-
‘Submarine Geothermics; Hydrothermal Vents and Electricity Generation’
http://www.iingen.unam.mx/es-mx/SitiosWeb/Proyectos/Impulsa4/Publicaciones/Documents/Submarine%20Geothermics%20Hydrothermal%20Vents%20and%20Electricity%20Generation.pdf
My synopsis (with added rough estimate):-
Of the 67 000 km of Ocean Ridges that are constantly recharging their thermal activity by the uprising of magma, so far 13 000 km have been studied representing 20% of the global ridges of the world. There have been reported 280 sites of hydrothermal vents along the ridges.
Hydrothermal vents in the ridges can be so extensive that plumes of heated water (60 °C up to as high as 464 °C) are continuous for upward of 100 km along axis.
13 000 km of explored ridges with a ph of 0.3 gives the equivalent of a long active ridge of 3 900 km long. An average width of this equivalent vent as 10 cm and a flow out at a velocity of 1 m/s at 250 °C, one gets a heat flow of 400 TW thermal using as a sink temperature 30 °C.
So a (rough) estimate of heat flow from the oceans hydrothermal vents is that 2,000,000,000,000,000 Joules (2 PJ) of heat is being pumped into the ocean PER SECOND.
Most of the hydrothermal vents are at a depth of 2000 to 2500 meters.
AJ, did you do something to Google Chrome. I no longer see the “Leave a Reply” button on google chrome. But I can see it in Firefox.
Awk! post something political. We’re all checking back often for something we can politicize on. While the global warming articles are great and interesting, a good political piece gets a hundred responses. I hate to post off topic.
politics – it’s all downhill from here. My best guess: Santorum wins the nomination, loses the general election, and we get 4 more years of Obama. BUT republicans take back the Senate and keep the House, so we can look forward to 4 years of bitterly divided government where nothing important will be addressed while the world goes to hell in a handbasket. And by 2016, we won’t have any choices to make anymore, just like the Greeks have no more choices to make today.
It’s like Gozer said at the climax of Ghostbusters: “CHOOSE!” We have the ability to choose the form of our destruction, but we can’t escape it. No way.
“During the rectification of the Vuldrini, the traveler came as a large and moving Torg! Then, during the third reconciliation of the last of the McKetrick supplicants, they chose a new form for him: that of a giant Slor! Many Shuvs and Zuuls knew what it was to be roasted in the depths of the Slor that day, I can tell you!”
[…] The question is, how many plumes are there yet to be discovered? Now let’s focus in on that plume I highlighted in the previous post: […]