Oct 19 2016
Recent Election Polls Show POTUS Tied Up
Update_2: OK, here is the updated data and computations adding in two additional general election polls:
Across all 7 polls
- HRC averaging 43.0%
- Trump averaging 40.3%
- Difference 2.7%
That is clearly a tie race, and I did not remove the Bloomberg outlier. If I do then we get
- HRC averaging 42.3%
- Trump averaging 40.7%
- Difference 1.6%
Yep, this race is back to a draw – as of today – – end update
Update: Stand by – RCP loaded 2 more General Election polls so will be recomputing – end update
My day job is to assess large amounts of technical data and look behind the numbers to see if there is more of a story than the bottom line. This means being critical of the assumptions most people draw from numbers they see, and assess them from a different angle. It is not easy to do, and requires a certain cynicism.
A good analogy is to not just accept the unemployment figures from the government without knowing that a huge swath of Americans are removed from the equation if they “leave the work force”. Most people do not know that the “unemployed” are a different pool of people than the “out of the work force” pool.
This means you need to look at both the size of the pool of workers who are outside workforce (and we are at one of the all-time highs right now) plus the unemployment number to draw the proper conclusion.
- A low number of people “out of the work force” combined with a low number of “unemployed” is a sign of a strong economy.
- A high number of people “out of the work force” combined with a low number of “unemployed” is NOT a sign of a strong economy. The larger the pool outside the work force the stronger an indication of a bad economy
We are at all time highs in terms of the number of people outside the workforce (90+ Million). So a low “unemployment” number is a false positive right now. Or better, it is a Democrat propaganda point (since most officials in DC know this about the employment statistics).
So when I look at the poll data I am seeing some very weird numbers. For one, the current New Jersey polls for POTUS at first blush looks great for Hillary. RCP has HRC up +11% right now.

But a closer look at the numbers also show a hint of warning for Hillary. Her average percentage is 50.8%, with Trump below 40%. But this is in a 2-way race. So Clinton is under-performing Obama by a huge amount. In 2012 Obama beat Romney 58.4% to 41.0%. So Trump is actually performing on par with Romney, but Hillary is behind Obama’s final tally by 8 points.
It becomes even worse if you remove the outlier poll (Rutgers-Eagleton). Recomputing using just the other three you get HRC 48% and Trump 41%.
Does this mean Trump has a chance to win New Jersey? Not really. But it does not look like Hillary is running away with this race either. Not in the least.
The other data I looked at was a snapshot of the POTUS general election. I understand the poll-of-polls models seem to indicate Hillary is pulling away. But to me it looks like she is bumping up against her ceiling and it is those people clinging to 3rd party candidates that keep Trump from pulling even. And Trump pulling even will be very, very very bad for Hillary.
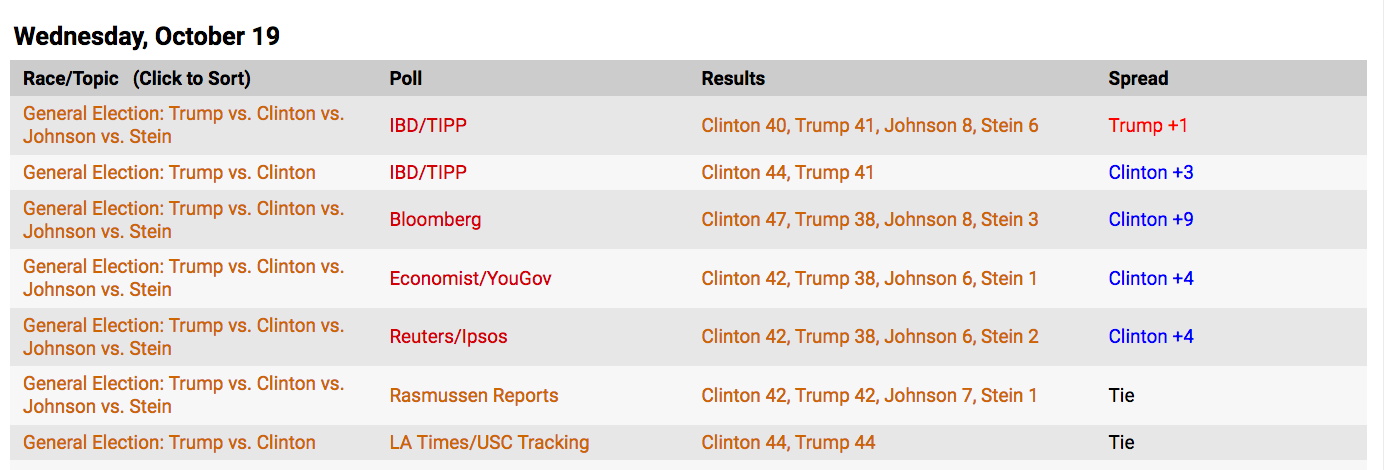
Look at today‘s general election polls at RCP:

There a 4 polls, so a very good sample to investigate. Again, at a glance it looks pretty good for Hillary, her lead is 0-9%. This results in an average lead of 3.5%.
But there is a lot more information in these numbers. Clinton’s average vote tally is 43.75%, with the Bloomberg poll looking to be a bit of an outlier. Trump’s tally is 40.50%. That is an insignificant 3.25% lead (not much different from just looking at the lead in isolation, but smaller).
So today, these 4 general election polls show a very tight race, with around 9% going to 3rd party candidates. Statistically this is a draw. Given the turnout models for this race are in uncharted territory this year, this is within the modeling MoE.
If we remove the Bloomberg poll (as a sensitivity test for the data, not to put on rose colored glasses) HRC is averaging 42.67% and Trump is at 41.33%. That produces a really insignificant lead of 1.34% for Hillary.
This actually is very consistent with the NJ poll I highlighted above. If she is struggling to put Trump out of the running in NJ, it would be reflected in a tight general election poll.
So today the data shows an extremely tight race. I checked the day prior (6 general election polls) and discovered this:
- HRC averaging 45.2%
- Trump averaging 40.5%
- Difference 4.7%
If I remove the top HRC poll (49%) and recompute:
- HRC averaging 44.4%
- Trump averaging 40.2%
- Difference 4.2%
So Trump has improved from yesterday to today. Is this a trend? Too soon to tell. But this race is CLEARLY not over.


[…] a reminder, yesterday at the end of the day we had 7 general election polls, with the […]