Apr 18 2008
Gallup Fails Statistics 101
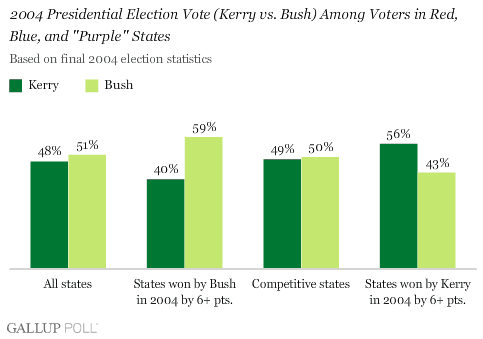
Gallup released an interesting poll showing who is wining (McCain vs Clinton/Obama) in states that Bush and Kerry won in 2006. What we see is the same as 2006, with Bush states going to McCain and Kerry states going to the dems. Here is the 2006 Bush-Kerry chart:,

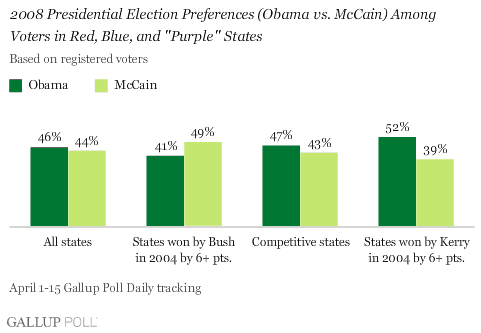
Note the 1% difference in all the states that were settled by less than a 6% margin. Bush won handily in 2006. Pathetically Gallup fudges on their headlines by claiming their poll results show a democrat lead in the states that were competitive, which is mathematically a lie. Let’s use the Obama-McCain chart as an example:

The graph shows a 4% difference. But you have to fold in the margin of error to understand the true statistical relationship. This is an aggregate of data across the daily tracking poll samples and is quite a large sample, so it has a low margin of error of +/- 2%. But that margin of error is enough to make the statistical difference anywhere from 0% to 8%. What is shows is basically a tie, not statistically different from the 2006 results. Which is a disaster for the dems. They should be well ahead of any GOP contender now because the race always drifts to the right as the day of voting comes upon us. Happens every year. If I was McCain I would be ecstatic right now.


At this point in 1988, I’m pretty sure Dukakis had an 8 point lead over GHWB. And in summer 2004, Kerry had a 6 point lead over GWB.
What tells me there’s something really hinky about the current polls is that they show Hillary still leading McCain, when even a large number of dems can’t stand her and a different poll showed those who “trust” Hillary are down to 36% nationally. So there’s a large portion of the electorate who wants to make Hillary president even though they don’t believe her and don’t trust her? I don’t think so.
WWS, agreed…but we need to remain vigilant.