Aug 14 2008
Record Low Summer Temps In Chicago – For A Decade!
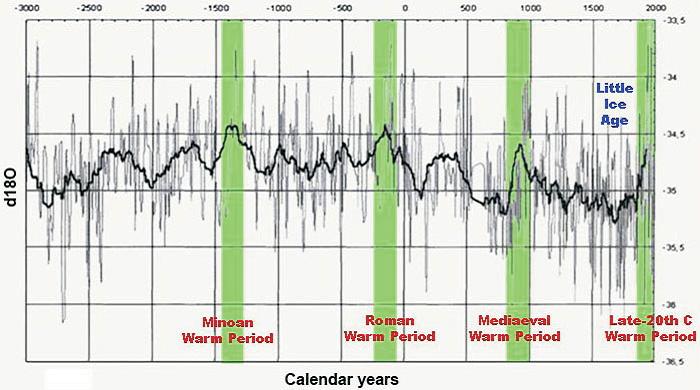
Where is the runaway global warming caused by human activity and driven by our ever widening Carbon Footprints? Ever since 1998 we have seen global cooling. Â In 1998 we hit a relative high global temperature – but not as high as humanity has seen before (see graph below) – and that is when the Chicken Littles inside the Church of Al Gore/IPCC began clucking the loudest about the pending end of the world.
Well, the Church of Al Gore/IPCC really need to get their heads out of the screwed up Global Models and do the unthinkable – look at the data. For example, Chicago is seeing one of the coldest decade in a century:
There have been only 162 days 90 degrees or warmer at Midway Airport over the period from 2000 to 2008. That’s by far the fewest 90-degree temperatures in the opening nine years of any decade on record here since 1930.
This summer’s highest reading to date has been just 91 degrees. That’s unusual. Since 1928, only one year—2000—has failed to record a higher warm-season temperature by Aug. 13.
Facts are stubborn things. And it takes true religious zealotry to ignore and deny facts when they show mounting evidence to the contrary of one’s beliefs. You would think a decade of cool summers in Chicago would be a sign that things are not as warm as they are being reported in the science challenged liberal media.


So we have been in a general cooling trend for the past 3500 years with periods of short term warming but each warm period seems to be peaking a little cooler than the previous one. That is pretty consistent with graphs I have seen of previous interglacials where it is warmest right after the end of the ice age and gradually cools until quite suddenly going into another ice age.
And we are talking 100K years per ice age and about 10K per warm period. Over the past couple of million years, Earth has spent 10 times longer in the grip of ice ages than in warmth.
Ice sheets will be what wipes out most of Northern Eurasia and North America. Most of Canada will be scraped off the face of the earth and deposited between New Hampshire and Nebraska.
Unfortunately the scientific facts are being manipulated.
You can read about the dispute concerning the “Hockey Stick” here:
http://en.wikipedia.org/wiki/Hockey_stick_controversy
I know it’s Wiki but I don’t see any evidence that it is not substantially correct.
Now read about the chicanery here:
http://bishophill.squarespace.com/blog/2008/8/11/caspar-and-the-jesus-paper.html
It’s rather complicated if you haven’t followed this controversy so I will try to briefly describe what happened.
The skulduggery was used to prevent the McIntyre rebuttal to the Mann hockey stick from appearing in a peer reviewed journal before the closing date for submittals to the UN IPCC4.
It involved a number of very disturbing anomalies in the peer review process – some think that there was some highly unethical behavior by more than one player.
If you do read the second post you can skim over the statistical discussions – why there was disagreement – and concentrate on the breaches of protocol in the peer review process.
Why does that graph only go through 1998? Why not include one that has calendar year data through the present date – or at least through, say 2006? Isn’t that available, AJ?
This is anecdotal, but I live in southern Indiana. I put out a garden and this year has been cooler. Initially it was wetter too. It did not help the garden.
What has surprised me is how cool the mornings have been.
Of course it’s available, but why torture yourself with the facts? The last 10 years are the proof you are hoping doesn’t exist.
uh, breschau, if you look at that graph, you’ll see periods -1400-1300……-200-100……and 800 thru 1000 when it was even hotter than 1998. Who was burning all the fossil fuels back then and exhaling all that CO2 that heated the world up back then?
And why is the peak in 1998 even lower than those other peaks?
the lefties are gonna panic if someone doesn’t come up with a good story soon.