Nov 26 2009
Where Does Global Warming Actually Come From?
The reason I ask where does global warming come from is not because I would be surprised or concerned to find the planet is still warming up from the Little Ice Age (which ended around 1850), but because if you look at the raw data there is no warming. Andrew Bolt in Australia has a similar fair question, which seems to be nearly impossible for the Australian alarmists who created the New Zealdn warming trend to answer:
Now New Zealand sceptics are asking how New Zealand’s National Institute of Water and Atmospheric Research created this iconic warming graph:
From this raw data:
Wow. The original data shows no real warming at all. How come?
Yeah, I how do you crazy alarmist scientists create results like that top graph from the data below? Look at the scales – they are not even the same! The upper graph shows temperatures well below the raw data for the early time period (shoved that data downward pretty good, didn’t they).
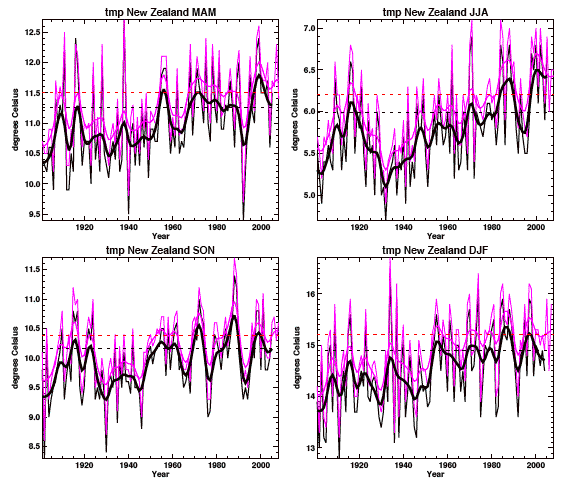
BTW, the CRU data for New Zealand does not look anything like the raw data either (but do note how much CRU raised the temps from 2005 (black dashed line) to 2008 (red dashed line)):

Supposedly CRU gets its data from the Aussie/NZ alarmists, so how is it they too ‘processed’ it into something different? I think taxpayers around the world, who fund this fuzzy math to the tune of millions of dollars, have a right to know what their money was spent on. NONE of these charts look like they are from the same country (or planet).
This is just like when I asked how we get this:
From 155 data sets that look like this:
We have a right to review the processing (and thinking) behind such magical data processing techniques. Especially when the people with these graphs are asking for trillions in dollars to simply make them look like the raw data again.
Think about it. They take raw temperature data, apply some questionable (and secret) processing to discover global warming, tell the world this means the end of humanity unless we pay up trillions of dollars, and then they can simply remove the secret math and declare success.
And alarmists wonder why people doubt their veracity?
Update: More on this at WUWT. I detect a world wide trend here. If there are raw data sets all over the world like this example (and there are of course), then there will be the death of a thousands graphs for global warming. The movement got to big, to exposed to hide from scrutiny. And now that scrutiny (required when things of this scale and cost are proposed) is going to get to the truth, and we shall see if the ‘settled’ science can hold up.
Personally, I suspect quite a few people inside the movement will bolt once they realize what these rampant zealots did to the professional reputations of their colleagues.


[…] The Strata-Sphere: Where Does Global Warming Actually Come From? […]
[…] What we see time and time again is one of two ‘tricks’ used by the alarmists to exaggerate or manufacture runaway warming. One is the application of ‘corrections’ which shove down the pre 1960 warm periods and raise up the most recent temperatures (see here and here). […]
YOu go AJ!! Good Lord, I’ve been exhausted talking to local climate huggers. They are so organized. (ie., within hours after this breaking..they already had canned responses, misdirection, press releases, etc…to steer this in some other direction. Mostly, based on the “trick” email…..ie., completely disregarding the context of it within the “rest” of what was available.
Kudos to you. I notice “Charles” over at LGF, appears to have chosen sarcasm and strawmen (ie. Newton) over actually looking at what was in the data. Shame…since he’s familiar with code, etc…he might be able to shed light on this himself….past just buying their explanations and passing it on.
[…] But now, with the CRU data exposed to the world we can get back to a real process, and it seems it will begin in New Zealand (sorry, can’t copy the text). The Parliament there is not standing for the one station excuse to let stand the questionable conclusions of massive global warming in New Zealand, when the raw data does not show any such phenomena. […]
[…] proxy data to open the error bars and move the trend lines to produce the desired result. We have a clear isolated example from New Zealand where cherry picked data and time windows have resulted in a ridiculous ‘data merging’ […]
[…] proxy data to open the error bars and move the trend lines to produce the desired result. We have a clear isolated example from New Zealand where cherry picked data and time windows have resulted in a ridiculous ‘data merging’ that […]