Dec 30 2010
Global Warming Hysterics – Where’s The Fire?

The worst-case accepted ‘guesstimate’ for the effect of man-made CO2 on the world’s climate is 0.74°C over the last 100 years, with statistical error bars of +/- 0.18°C. Because of this minuscule level of supposed global warming over the last century, all of humanity must be financially punished for the next century – of course paying trillions of dollars to the holier-than-thou liberals (who just coincidentally all the while become rich and powerful).
0.74°C – Oh the horror!
Everyone needs to put this data into perspective. I went to The Weather Channel website and found some interesting graphs. If you click on the ‘monthly’ blue tab at the top, and then the ‘average’ orange tab on the bottom, you can see the range of temperatures for any city in the world. For US cities you can add record high and low temperatures, and you get something like this, as I generated for Washington DC:
As we look at this it is clear a change in 0.74°C will not make much difference to the region or its weather. If the January average was to change to -3.74°C – 6.74°C it would not change the biosphere around Washington DC. That is a change of 8% – nothing dramatic. If July went from 21.74°C – 31.74°C it would not be anything to raise alarm bells over.
If the annual average low to average high around Washington DC was -3.74°C – 31.74°C this would not make a ripple in weather or biological systems. Why?
That is because the full range of temperatures is actually captured within the record high and lows for each month. That is the range of temps the region deals with over long time periods. The monthly averages simply show the most common monthly temperature range – not the full range. January has fluctuated 52°C around DC, well outside the 9°C range of the monthly average. July has fluctuated 30°C – three times the range of that month’s average. This is NORMAL! You see the same pattern for Chicago and New York City and any damn place you wish to chose. Life is much more robust than what the alarmist like to pretend. The Earth is much more dynamic than the alarmists admit.
Today in DC it is predicted to be a low of 1° and a high of 7°C. Does anyone think it matters if it is a low of 1.74° and a high of 7.74°C? No, it does not.
Every day, every week, every month and every year regions of this planet experience ranges of temperature that dwarf the alarmists’ cries of doom over 0.74°C per CENTURY. People can stop panicking now – you can’t even dial down your home thermostat by that much – its too small a number.. The Chicken Littles had their 15 minutes (more like a decade) of fame and were proven to be wrong. Their so-called scientific predictions of doom have been proven wrong.
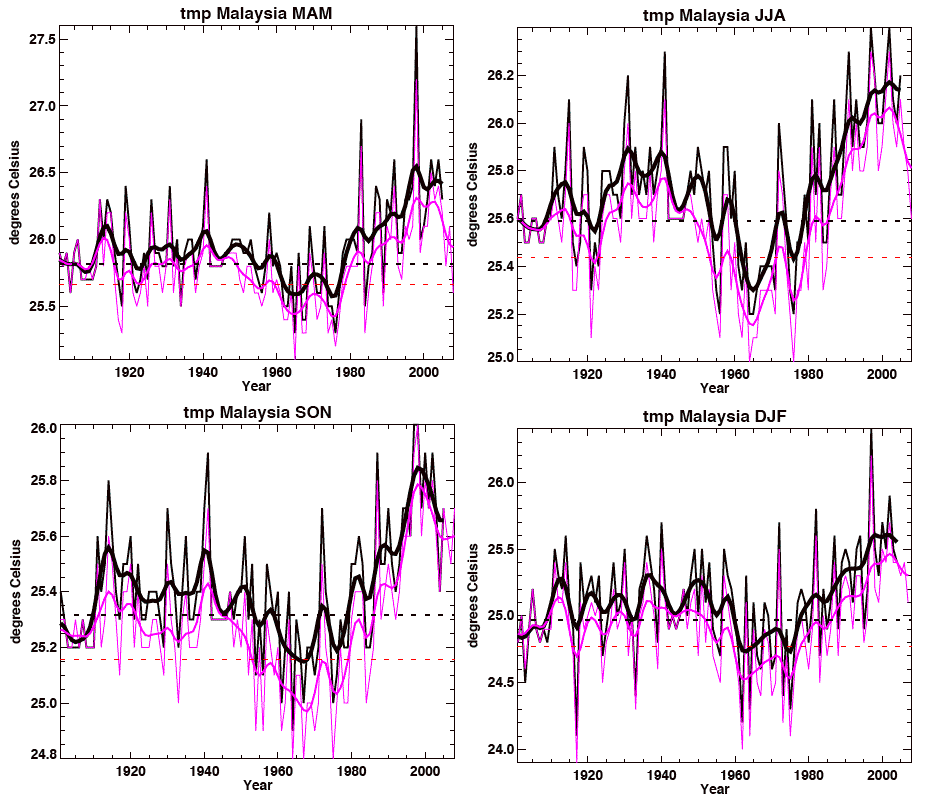
In fact, the one place on the Earth were the annual temperature does not vary by more than a couple degrees a year, and less than a degree per season in many cases, shows no sign of this mythical 0.74°C increase in global temperature (click to enlarge).
The source of this data is CRU (thanks to climategate), prior to any of those ‘funky’ adjustments they make to the record. The temperature in Malaysia has been bouncing around the same temperature for 100 years. Those temperatures in their summer are rarely changing by more than 1°C. The scale on the middle two charts, running from June through November, is in 0.2°C increments. Therefore the temperature for this period never varies beyond 1°C and 1.2°C. Hasn’t in 100 years.
How is it that Malaysia, with its incredibly limited annual temperature range, did not experience global warming? Is it possibly due to the fact there is no global warming – just normal seasonal and decadal changes covered up by questionable and unproven ‘math’?
Over at WUWT there is another interesting chart – it shows the last century’s changes in temperature and CO2 (click to enlarge):

Two things to note. First, the beginning of this record covers the last bit of the Little Ice Age, as the world finished warming to what some believe is its normal state. If the Medieval and Roman Warm Periods are considered the normal high range for the last couple of thousand years, then we may just now be getting back to that point after the Little Ice Age.
The second thing to note is the change due to CO2 levels rising – the period 1940 onward. As I have said many times, the error bars on annual median temps are on the order of 1-3°C (or greater). Which means any guesstimates of multi-decade temperature changes below 1°C are statistical noise and not real. But even if this was all real, the change in global climate could only be 0.4°C! Here’s the big picture – with full perspective:
Where’s the fire folks? Those who screamed ‘fire’ need to explain where the fire is? Or else they deserve to be shunned and their credibility stripped from them for all time.


[…] Zimbabwe West? – hotair.com 12/30/2010 Or the New Ukraine, circa 1936? more… Global Warming Hysterics – Where’s The Fire? – strata-sphere.com 12/30/2010 The worst-case accepted ‘guesstimate’ for the […]