Nov 21 2011
BEST’s Lead PhD Confirms AJStrata’s Global Warming Myth Busting
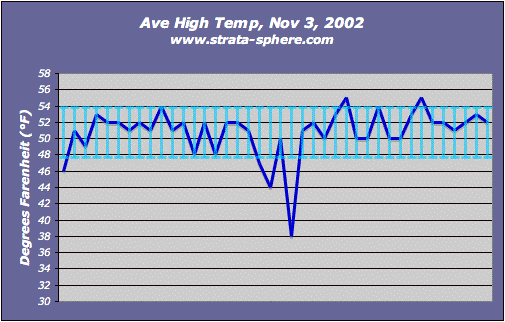
In June of 2010 I posted on a simple experiment I did that indicated to me there was clearly no way any sub-degree global warming could be detected from surface temp records – even from modern surface temperature records. The back of the envelope calculation I did was quite simple. I sampled one day of temperature highs (Nov 2, 2002) from the area where I live outside DC that spans a 160 km region. The region around DC is very homogenous in terms of geography and urbanization, so temperatures tend to be very similar. It is a very benign region where the spatial correlation of temps is pretty strong. When I did the analysis I discovered for that one day:
- The minimum value was 38° F with the highest being 55° F
- The measured range was 17° F for this typical day in November
- The average (mathematical mean) was 50.8° F, with a standard deviation [1] of 3.05° F
- The average deviation was 2.00° F
Here is the graph of daily high temperature (dark blue line) along with a 1 standard deviation error bar (light blue bars).
[Click any graph to enlarge]
What this told me straight off is that any single measurement point on the surface of the Earth can only be extrapolated 160 km IF you accept the fact that the temperature for the overall region will be +/- 3° F (or roughly +/- 2° C). And this is using modern measurement capabilities in a very homogenous region. The further back in time you go the larger these error bars become. Even the infamous global warming alarmists at CRU understood temperature readings were only good to many degrees (2-4°C) in 1961:

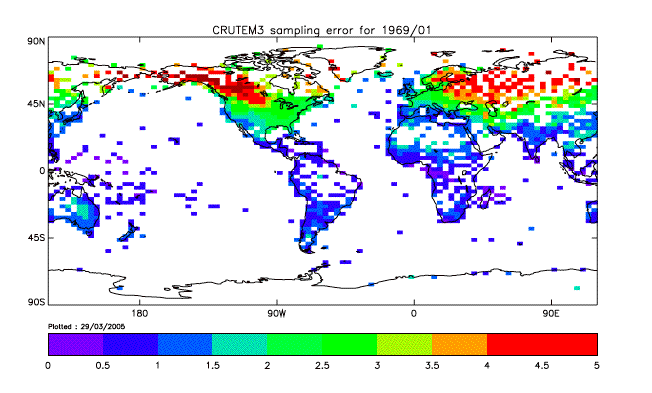
This graph comes from a CRU document. Their own analysis indicates that the temperatures for each grid (500 km square) that make up the record for 1961 is only accurate to 1-3° C in most cases. If 1961 is only accurate to this level, all the other years are no better.
NASA GISS attempts to extrapolate a single surface site reading not just 160 km, but anywhere from 400-1000 km (thus making the wild assumption the temperature in Los Angeles reflects the Temperature in Oregon). GISS temps are well beyond a +/- 4° accuracy in any region this large – thus their claims to have detected a 0.8° C trend over the last century is bogus on its face. Why so many PhDs fail to understand this basic tenant of math is beyond me. Why Journalist with elementary school level math can’t grasp this is no big surprise. I wouldn’t want them attempting brain surgery either (but being an expert in statistics and climate science is so simple!). So they get a pass, if not a laugh at their instant IQ points when it comes to preaching to ‘the skeptics’.
Here is a GISS map, and then a real NASA temperature image from one of our state-of-the-art weather satellites. Notice the drastic difference in precision and accuracy?


GISS has the precision of a sun dial on a cloudy day, while the satellite shows the true geographical area of any cool or warm region.
As folks who follow this issue know, a new (and controversial) effort was made to run the same error prone temp data through another round of statistical analysis to see if the result would change. Funny enough, 2+2 still equals 4. This exercise is redundant silliness goes by the acronym BEST.
The head of BEST has made news by producing press releases on results not even through peer review yet and by claiming the Earth has been Warming (which is might have been doing since we left the Little Ice Age less than 200 years ago). He also made news by hiding the fact the last 10-15 years has shown no warming and probable cooling. Like a moth to the flame, the BEST team has been running around trying to find the latest hot camera to wallow in their 15 minutes of whatever.
Recently, they were paraded up to Capital Hill to testify for the Democrats on Man-Made Global Warming. And during that testimony – under oath – a very important admission was made:
Professor Muller presented himself as a former skeptic, but he couched his skepticism as questioning the quality of the land-base surface measurements – according to him 70% of measuring stations in the US are poorly sited with a possible error of 2 to 5 degrees C.
Here we see again the same maximum precision obtainable from the temperature record, which precludes any claims of sub degree signals being mathematically possible. So it is not just AJStrata saying the global temperature record is unable to make claim of any warming below a degree, it is CRU and BEST as well.
What the alarmists have done is used averaging to dilute the record and pretend the resulting foggy haze is precision when it is not. Averaging can sometimes elicit trends, but the trend must be beyond the noise of the measurements – which the current alarmist claims are not. Just look at how they ignore the true variability of temperature (from days to years) by collapsing or wiping out information down to a useless single number:
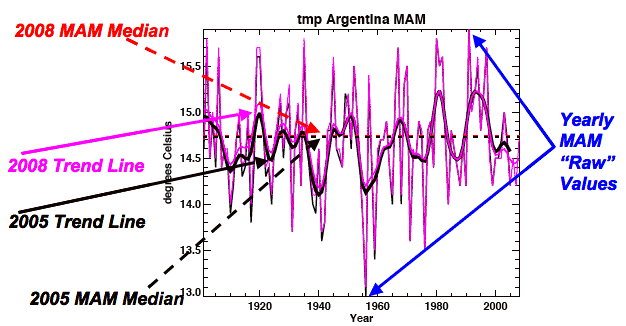
Again, this is a CRU data set and graph (which was made public during Climategate). I added the labels. For someone like me, trained in math, statistics and graphs this tells me a lot about what is so wrong with the ‘science’ of global warming.
What you are seeing is the complete CRU historic record for Argentina, from 1900 to 2008 covering the months of March April May (MAM). The black line is the 2005 run of the CRU data set, the magenta is the 2008 run. The first problem I see is that temperatures change for any given year every time CRU runs its data. Now we know the temperature was a specific number for this region in 1920. As they say: it’s history. When CRU changes the 1920 temp up a few tenths of a degree between its 2005 and 2008 runs you know you are working with theoretical numbers – not hard measurements. CRU admits it has multiple layers of unproven speculation inside their graphs (which take local values for a day, average them over months, and grid them over large regions). Even the root data in this graph is highly processed theory.
But also note the variability of temperature in Argentina – 2.9°C between the low in 1956 and the high in 1990. How would a 0.8° C increase over 100 years bother Argentina? That’s a 0.008° C increase per year. Biological systems can handle this easily. You couldn’t even tell if the temp was 0.8° C higher rom one year to the next (let alone from one century to the next).
Even more intesresting, for the months of MAM, Argentina has been steadily COOLING since 1990.
CRU wipes all this information out by going to the averaged values (‘trend lines’) of what is already spatially (Argentina) and Temporally (MAM) averaged local temp data! There is no way to discern any real long term trend from the slope of a line intersecting the 3-5 year rolling average of an estimated regional temperature from measurement sources that could be off regionally as much as the variability seen in the over temps. Its mind boggling silly.
Remember – no single site can accurately represent represent a 160 km region within 2-3° C!
Statistically speaking, Argentina has neither warmed nor cooled. And neither have most of the places on the planet.
BEST is the latest in a long line of sources noting that the temperature record is incapable of teasing out a trend less than 2-3°C, since measurement noise at the regional regional level and the natural variability over the years totally overwhelm the data points.
For all we know the entire warming trend is due to more measurements of higher fidelity coming on line, which in turn more accurately measured what was always there.
What we do know is those claiming humankind is driving global warming don’t know their math and science as well as their PhD may imply. That is if they have one in the first place …


This post reminded me of three types of lies:
1. Outright lies (when close to the 100% of the statement is false).
2. White lie (when the statement is mostly correct, but the statement doesn’t disclose the whole “picture”).
3. Statistical lies…..
I think the international socialists chose the statistical lies method by design, to carry their “global warming”/”climate change” scam to victory, knowing how difficult is to educate people, when, at best 50% or the people, are not ideological inclined to believe the lie.
Very good post. I appreciate you taking the time to summarize these findings. It still amazes me that there are some people that actually think that the everyday activities of humans have an effect on the weather.
I thought my daughter was going to get through high school without having to watch “Inconvenient Truth”. Darn. She just informed me that her environmental science class is watching it today and tomorrow. Atleast her teacher did say to ‘take it with a grain of salt’ and that ‘it might not all be true’. We had a talk.
AJ,
A heads up for you – looks like a Climategate 2.0 may be brewing. Check it out at Jeff Id’s site “The Air Vent” (http://noconsensus.wordpress.com/2011/11/22/climategate-2-0/).
To be honest, the statements made in the e-mails are really not surprising, but simply confirm what we’ve already suspected…
good e-mail trove, I hadn’t seen that Archtop. Here’s one of my faves, as you said, not really surprising – but the blog Real Climate is the home of the AGW cultists, who spend all their efforts into vilifying anyone who doesn’t fall down and worship at the temple of Global Warming while pretending that they are the Keepers of Truth and Light.
From Micheal Mann:
“the important thing is to make sure they’re loosing the PR battle. That’s what the site [Real Climate] is about.”
As you said, we knew that. And now we know that they always knew it, too. This is not a case of some people just being wrong – this is Fraud, plain and simple, and it has been from the very beginning. It is the way a small group of otherwise marginal people chose to divert vast amounts of wealth and attention to themselves.
And since it IS a pure fraud, there will NEVER come a time when they simply lay down and say “oh, you were right”. They will fight it to the bitter end, until they are destroyed completely.
Thanx Archtop – downloading now!
[…] the data has been rinsed and massaged with so many unproven assumptions its error bars are massive (see here for my latest post on error and precision). Locally (e.g., America) there has been no warming, and none is expected to show up for decades […]