Nov 22 2011
Phil Jones of CRU/IPCC: Only 20% World Is Warming?
As noted earlier we have another round of Cimategate emails (though not so useful documents) out this fall – just in time to consume my Thanksgiving weekend. I just ran across one that has a very interesting (if unclear) statement by one Phil Jones. It is in email file <0031> dated March 2003, and is a chain of responses to a paper [by Baliunas and Soon] that shook up the alarmist camp. Near the beginning of the chain (end of the file) Phil Jones writes this:
The phrasing of the questions at the start of the paper determine the answer they get. They have no idea what multiproxy averaging does. By their logic, I could argue 1998 wasn’t the warmest year globally, because it wasn’t the warmest everywhere.
With their LIA being 1300-1900 and their MWP 800-1300, there appears (at my quick first reading) no discussion of synchroneity of the cool/warm periods. Even with the instrumental record, the early and late 20th century warming periods are only significant locally at between 10-20% of grid boxes.
Writing this I am becoming more convinced we should do something – even if this is just to state once and for all what we mean by the LIA and MWP. I think the skeptics will use this paper to their own ends and it will set paleo back a number of years if it goes unchallenged.
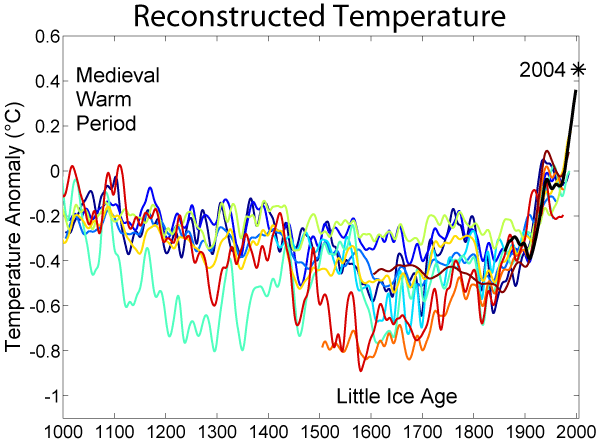
This is a pretty damning admission – though I have to admit it is hard to parse Jones’ writing at times. If you look at any variant of the infamous Hockey Stick graph you see two sets of data. One is the instrument record (which is NOT raw data but raw data that has been processed and cleaned by alarmists) and then the paleo-record from proxies such as tree rings (see below from Wikipedia).

The black line is the so called modern warming, the thing everyone claims is runaway warming from human generated CO2. But what Jones is admitting is that at the grid (i.e. local level) there is no warming at 80% of the grids. This black line summary hides a lot of important details. You only see warming only at the regional, hemispheric and global levels – where the data has been rinsed and massaged with so many unproven assumptions its error bars are massive (see here for my latest post on error and precision). Locally (e.g., America) there has been no warming, and none is expected to show up for decades (according to CRU, GISS, etc).
This is quite damning if true. We know that many areas of the Earth are NOT showing warming, and in fact are showing cooling. Even CRU agrees (email <0003> from Briffa to Bradly on Nov 13, 2000):
The bottom line is that if you show the annual map in the Synthesis paper, there are quite a few areas that have not warmed. Incidentally, the significant trends are indicated as areas enclosed in black lines, and southern Greenland and the oceans to the east of it have clearly cooled (though most boxes are NOT significant. Other cooling areas are extreme south east USA; west central South America; east central Africa and south east China. Probably 95 per cent of the area with data has warmed though. If you just plug in all areas with at least 25 years coverage , very large areas of the map cool.
Good lord, even the data was not ‘settled’ – just spun by snake oil salesmen like Mann, et al. Clearly Congress should investigate, and the EPA should be suspended from any action (new or old) until this gets sorted out.


Congress does not have the competence to investigate climate issues and even if they did their entrenched political positions will not allow the truth to govern their actions.
Executive orders and government by regulation are proving to be an effective end-around of Congress and until an election changes the dynamic within Congress no meaningful action will occur that curtails the Executive from doing whatever it wants. Congress is MIA – just look at their budget – the one that hasn’t been passed for over 900 days.