Oct 22 2016

10_22_16 General Election Polls: Toss Up, Trend Continues For Trump

This is the fifth day I have looked at the general election polls for POTUS at RCP. My previous posts were:

This is basically an uncomplicated assessment of the general election taken each day by averaging the % of the general election polls for each candidate. It is a daily poll-of-polls assessment, and it has been interesting because this data appears to suggest a very different race than the headlines.

For the 5th day the race looks to be a statistical tie or toss up, and today we only have 3 polls (click to enlarge):

POTUS RCP 10_22_16

  • HRC averaging 42%
  • Trump averaging 42.67%
  • Difference 0.67% (Trump)

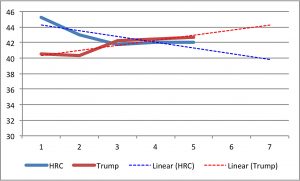
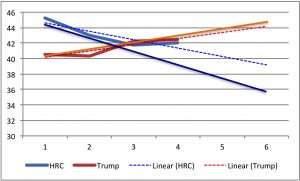
However, if we look at the trend over these past 5 days we actually can detect a trend towards Trump. He is slowly rising while Hillary has been trending downward or, at best, flat.

Gen_Elect_Trend_10_22

Trumps differential has moved over this period from -4.70% behind Clinton to +0.67% Ahead.  He has polled slightly ahead of her for the last three days (basically since the last debate)

If this holds it is very bad for Clinton and the rest of the Political Industrial Complex. This could be why the Clinton-backing “news” media continues to abandon all objectivity and go all Sleaze Guns on Trump.

2 responses so far

Oct 21 2016

Florida Early Voting Data Shows GOP Ahead Of 2012

In Obama’s 2012 reelection the Democrats produced more “early voting” ballots in Florida than the GOP did (obviously these are not votes for a candidate, but simply ballots by party ID). They led the GOP by 3% last cycle.

Florida

Votes: 4.3 million

Democrats: 43%

Republicans: 40%

That edge in early voting no doubt helped push Obama over the top in Florida to beat Romney:

                                      President Barack Obama, 2012 portrait crop.jpg Mitt Romney by Gage Skidmore 8.jpg
Popular vote       4,237,756   4,163,447
Percentage        50.01%   49.13%


Note the actual vote difference in 2012 was very small = 74,309.  The early voting ballot tally for the Dems represented a lot more than the difference = 129,000. Keep this in mind as we look at this year’s data.

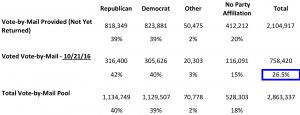
This year the FL Democrats ARE NOT doing as well as they did in 2012 in early voting (per this site). This year the GOP is ahead in ballots requested AND ballots returned (so far). The table below is the data from the FL site with additional information (click to enlarge):

FL Early Vote 10_1_16

The way FL presents their statistics is a little confusing. The top row is the number of ballots requested, but not yet returned. The second row is the number of ballots returned = votes cast by Vote-by-Mail. Everyday both rows change. So to compute the total potential ballots you need to sum the first two rows, which I did in the 3rd row.

As of today, the GOP is returning 2% more of the ballots than the Democrats (middle row percentages). This is nearly completely opposite the trend in 2012. Moreover, GOP voters requested more ballots than Democrats (bottom row percentages).

Now I draw your attention to the blue box in the middle row. That is the number of returned ballots out of the overall total pool of ballots requested (3rd row). So 26.5% of all requested ballots have been returned.

If you are familiar with election night results, you know you really cannot get a solid feel for any state race until at least 25% of the precincts report in. That is because you need a decent fraction of the total votes to be confident the trend you see will pretty much hold.  The closer you get to 90% the more stable the vote percentages become. I usually consider the race called at 50% (though you have to watch for late reporting large precincts).

Interpreting this data then (which is dynamic) one could argue Hillary needs to replicate Obama’s lead of 3% in Early Voting to eek out a win in Florida. Not only is she not doing that, the fact the Democrat voters did not request a lot more ballots than the GOP voters means it is highly likely SHE CANNOT replicate Obama’s turnout. That would require the GOP to not return ballots in huge numbers – which is clearly not happening.

In case you are wondering:

  • The GOP voters have returned 28% of requested GOP ballots
  • The Dem voters have returned 27% of requested Dem ballots
  • The “Other Party” voters have returned 29% of their requested ballots
  • The “No Party” voters have returned 22% of their requested ballots

So the Dems are returning ballots at about the same rate as the GOP.

Word of caution – there is still actual early voting at a ballot box to kick in. So while this is a good sign, it is not a predictive sign.

Note: the numbers listed from 2012 were reported Nov 1st, 2012 – before any votes were counted!


One response so far

Oct 21 2016

10_21_16 General Election Polls: Tied, With Small Trend For Trump

Another day closer to the election, another quick look at the General Election polls and where they may be heading.  As with the prior three days, we are looking at the vote totals for Clinton and Trump in today’s polls (10/21/16):

POTUS RCP 10_21_16

  • HRC averaging 42%
  • Trump averaging 42.5%
  • Difference 0.5% (Trump)

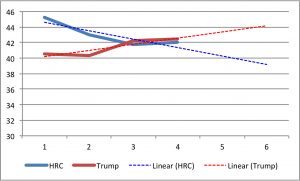
Today there is no change between the two candidates from yesterday (Trump up 0.5%). Both candidates moved up 0.25% in their averages from yesterday.  This actually helped Hillary in terms of the trend lines, leveling out what was a deep dive.  But Trump still points upward

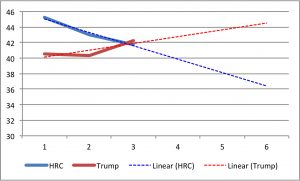
The first graph is for today, and the second graph shows yesterday’s trend lines overlaid on today’s chart. Clinton’s trend line is not diving as fast, but Trump’s is still looking to rise more. Basically, it is a tie with a hint of a trend for Trump.

10_21_16 Trend_1

10_21_16 Trend_2


4 responses so far

Oct 20 2016

Did Democrat Intimidation & Violence Backfire?


I have been wondering if we are seeing some unintended consequences from the violent intimidation of Trump supporters by the Democrats. This intimidation was meant to chase off Trump voters, but what if all that happened is the supporters decided to run silent and deep, and await their turn at the ballot box.

Let’s look at some stories playing out right now to see if this is plausible.

First off, we know Democrats and their affiliates have been paying people to violently intimidate Trump supporters:

Two Democratic political operatives with ties to her White House bid have indeed been caught up in a conservative group’s sting operation that appears to suggest efforts to send plants into the Trump’s rallies to cause trouble.

The Democrats — Robert Creamer, the husband of Illinois Rep. Jan Schakowsky, and contractor Scott Foval — both have left their jobs this week after several edited videos appeared produced by conservative activist James O’Keefe and his group Project Veritas Action.

In one of the videos, Foval, the national field director for Americans United for Change, discussed with an O’Keefe operative, who was posing as an intern, a strategy that included sending plants into Trump rallies to pick fights with his supporters.

“I mean, honestly, it’s not hard to get some of these assholes to pop off,” he says in the video. “It’s a matter of showing up, to want to get into their rally, in a Planned Parenthood T-shirt. Or ‘Trump is a Nazi,’ you know. You can message to draw them out, and draw them out to punch you.”

More here.

What kicked off this train of thought was a report on how open support for candidates (e.g., yard signs) is not very prevalent this year:

As Nov. 8 approaches, fewer people than usual are displaying their political affiliation via signs or stickers because tensions are running so high. Residents in Dedham said they understand why people are hesitant to make their political views public.

Some said they would worry about their car getting destroyed if they attached a political bumper sticker. Others said they’d be afraid of violence if they advertised support for Donald Trump because many in Massachusetts vote Democrat.

I can relate to that.  The violence we have seen this season (with hindsight – now likely due to Democrat shenanigans) is serious.  Just watch this in its entirety:

The people attacked by the cowardly thugs were peacefully participating in our democracy. So obviously just participating in the process for Trump supporters comes with a clear threat.

Side note: One wonders about the silly Chris Wallace question about peaceful transitions, and why he did not ask Hillary if she would direct all her supporters to allow a peaceful election!

I can now see why yard signs and bumper stickers are a rare (and brave) occurrence.

So if people are afraid to openly announce they support Trump with signs and stickers, maybe they are also afraid to tell pollsters who they support as well?

Does not seem unreasonable. Clinton supporters have nothing to really fear, but Trump supporters have seen a string of attacks (and now confessions) and they know are being targeted.

Seems to me there could be a lot of false polling responses out there if this is true. It may be the Democrats created an environment that naturally produces a false tilt towards Hillary in the polls. One which of course will be ripped away come election day in the privacy and anonymity of the voting booth.


Comments Off on Did Democrat Intimidation & Violence Backfire?

Oct 20 2016

Today’s General Election Polls Show Toss Up, Trending Trump

I thought it might be interesting to look at just the recent polls until the election, since where we are heading over the next three weeks is more important than were we have been over the last few months.

So here is the midday snapshot of the RCP polls for today, October 20th, 2016:

POTUS RCP 10_20_16

We have 4 general election polls out with some fascinating numbers:

  • HRC averaging 41.75%
  • Trump averaging 42.25%
  • Difference 0.5% (Trump)

As a reminder, yesterday at the end of the day we had 7 general election polls, with the following

  • HRC averaging 43.0%
  • Trump averaging 40.3%
  • Difference 2.7% (Hillary)

And the day before that we had 6 general election polls, with the following

  • HRC averaging 45.2%
  • Trump averaging 40.5%
  • Difference 4.7% (Hillary)

So over three days Hillary’s lead has decayed from +4.75 to +2.7% to -0.5%.

If we plot these 3 days, and then lay out a trend line three days into the future (dashed lines), then we get this:

10_20_16 Trend_1

These trend lines will be used as a test to determine if the trends are actual.

Stay tuned. If more General Election polls come out I will update the numbers. Will be back tomorrow to see where we might be headed!

Methodology: Simple. Sum up Hillary’s vote % in each poll, divide by the number of polls.  Rinse and repeat for Trump.

2 responses so far

Oct 19 2016

Live Blogging Last Debate 2016

Published by under All General Discussions

Update 11:10 PM Eastern:

My  view: Trump did very well. Clinton failed. Watch the polls, because HRC slung mud and Trump had solid answers. Trump win.

Update 11:07 PM Eastern:

Sorry for the delay.

Wallace: Entitlements: can we save medicare and social security/

Trump: Grow the economy and repeal Obamacare and we can save these programs. Change course or not.

Clinton: Put more money n trust fund by raising taxes on rich. I will not cut benefits for low income and women. She is responds with policy numbers. ACA extended Medicare (Trump: your husband disagrees with you – shots landed).

Wallace: final time together. 1 minute for closing statemrnts

Clinton: I am reaching out to everyone (even Les Deplorables?). She has seen POTUS up close and stand  up to famines (the little people) Give me a chance

Trump: She is raising money from the people she wants to control. We need defense, we need law enforcement. I will do more for Latinos and African Americans than she can do in 10 lifetimes.

Continue Reading »

Comments Off on Live Blogging Last Debate 2016

Oct 19 2016

Recent Election Polls Show POTUS Tied Up

Update_2: OK,  here is the updated data and computations adding in two additional general election polls:

POTUS RCP 10_19_16_v2

Across all 7 polls

  • HRC averaging 43.0%
  • Trump averaging 40.3%
  • Difference 2.7%

That is clearly a tie race, and I did not remove the Bloomberg outlier.  If I do then we get

  • HRC averaging 42.3%
  • Trump averaging 40.7%
  • Difference 1.6%

Yep, this race is back to a draw – as of today – – end update

Update: Stand by – RCP loaded 2 more General Election polls so will be recomputing – end update

My day job is to assess large amounts of technical data and look behind the numbers to see if there is more of a story than the bottom line. This means being critical of the assumptions most people draw from numbers they see, and assess them from a different angle. It is not easy to do, and requires a certain cynicism.

A good analogy is to not just accept the unemployment figures from the government without knowing that a huge swath of Americans are removed from the equation if they “leave the work force”. Most people do not know that the “unemployed” are a different pool of people than the  “out of the work force” pool.

This means you need to look at both the size of the pool of workers who are outside  workforce (and we are at one of the all-time highs right now) plus the unemployment number to draw the proper conclusion.

  • A low number of people “out of the work force” combined with a low number of “unemployed” is a sign of a strong economy.
  • A high number of people “out of the work force” combined with a low number of “unemployed” is NOT a sign of a strong economy. The larger the pool outside the work force the stronger an indication of a bad economy

We are at all time highs in terms of the number of people outside the workforce (90+ Million). So a low “unemployment” number is a false positive right now. Or better, it is a Democrat propaganda point (since most officials in DC know this about the employment statistics).

So when I look at the poll data I am seeing some very weird numbers. For one, the current New Jersey polls for POTUS at first blush looks great for Hillary. RCP has HRC up +11% right now.

NJ RCP 10_19_16

But a closer look at the numbers also show a hint of warning for Hillary. Her average percentage is 50.8%, with Trump below 40%. But this is in a 2-way race. So Clinton is under-performing Obama by a huge amount. In 2012 Obama beat Romney 58.4% to 41.0%.  So Trump is actually performing on par with Romney, but Hillary is behind Obama’s final tally by 8 points.

It becomes even worse if you remove the outlier poll (Rutgers-Eagleton).  Recomputing using just the other three you get HRC 48% and Trump 41%.

Does this mean Trump has a chance to win New Jersey? Not really. But it does not look like Hillary is running away with this race either. Not in the least.

The other data I looked at was a snapshot of the POTUS general election. I understand the poll-of-polls models seem to indicate Hillary is pulling away. But to me it looks like she is bumping up against her ceiling and it is those people clinging to 3rd party candidates that keep Trump from pulling even. And Trump pulling even will be very, very very bad for Hillary.

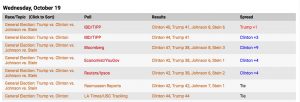
Look at today‘s general election polls at RCP:

POTUS RCP 10_19_16

There a 4 polls, so a very good sample to investigate. Again, at a glance it looks pretty good for Hillary, her lead is 0-9%. This results in an average lead of 3.5%.

But there is a lot more information in these numbers. Clinton’s average vote tally is 43.75%, with the Bloomberg poll looking to be a bit of an outlier. Trump’s tally is 40.50%. That is an insignificant 3.25% lead (not much different from just looking at the lead in isolation, but smaller).

So today, these 4 general election polls show a very tight race, with around 9% going to 3rd party candidates. Statistically this is a draw. Given the turnout models for this race are in uncharted territory this year, this is within the modeling MoE.

If we remove the Bloomberg poll (as a sensitivity test for the data, not to put on rose colored glasses) HRC is averaging 42.67% and Trump is at 41.33%. That produces a really insignificant lead of 1.34% for Hillary.

This actually is very consistent with the NJ poll I highlighted above. If she is struggling to put Trump out of the running in NJ, it would be reflected in a tight general election poll.

So today the data shows an extremely tight race. I checked the day prior (6 general election polls) and discovered this:

  • HRC averaging 45.2%
  • Trump averaging 40.5%
  • Difference 4.7%

If I remove the top HRC poll (49%) and recompute:

  • HRC averaging 44.4%
  • Trump averaging 40.2%
  • Difference 4.2%

So Trump has improved from yesterday to today. Is this a trend? Too soon to tell. But this race is CLEARLY not over.


One response so far

Oct 17 2016

Clinton Campaign Knew Contents Of Classified Emails

The John Podesta emails released by Wikileaks are by and large mundane. But occasionally you find a real stunner. In this case it is clear the contents of the classified emails that Hillary sent/received over her private server where known way outside the State Department. While preparing for a big email presser, team Clinton exposes how much they also knew about the emails and their classified content.

Titled: “Re: We haven’t had a good war with NYT in awhile”, circa Nov 2015

Heather talked to I believe Alex gerlach [sic] at State, who said they were hearing only one email had so far been ruled out as Top Secret. Separately, two reporters who were trying to confirm Gerstein’s report with ODNI reported back to us that they were hearing the same.

Alec Gerlach is/was the Department of State Spokesman. The person writing this portion of the email chain was Brian Fallon, the Clinton Campaign’s national press secretary. Note how Fallon is describing how two reporters and the State Department spokesman are providing the Clinton campaign intel on the status of classified emails. “Heather” is more than likely Heather Samuelson, a Clinton Campaign lawyer.

So the fact all these people are discussing the classified emails Hillary communicated unprotected is not an issue. It is the fact they all seem to know the contents of the emails:

The rumor was not that ODNI had completed the review and determined only one was not TS and the other was, but rather that they had only reached a definitive conclusion on the one (we think the North Korea email that supposedly relied on satellite imagery) and were still deciding on the other.

To which the campaign’s Traveling Press Secretary, Nick Merrill, responds:

That’s good intel. And frankly if we had to live with just one[,] better for it to be the one about a news article that discusses the drone operation.

So now we know one email had classified information that could only be gleaned from satellite imagery (which tells our enemies what we can see from space so they can adjust) and the other was on how drone operations work. And apparently Clinton’s top campaign staff knew the contents as well since they banter on and on about them with what appears to be first hand knowledge.

All this ties in nicely with information gleaned from the recently released FBI documents. Specifically on how Hillary Clinton issued orders about private email services and protecting classified material:

Yet early in her tenure she advised staffers against it.

“Clinton sent out an all-staff cable that personal email should not be used day-to-day for business purposes and that personal email is not secure, so do not use them for business purposes,” according to an FBI report released as part of a 100-page document dump.

So not only did Clinton violate her own directives on classified materials and private email services, she compounded the exposure by allowing her campaign team inside knowledge of the contents, which they IN TURN emailed around unsecured among themselves!

To be fair, there were news reports on the drone operations and satellite data, but no one should have confirmed or denied details (by HRC or her lawyers if they had clearances).

And these are the people we should be handing the leadership of our great country over to???


One response so far

Oct 17 2016

Hillary Has No True Positions On Anything


H/T to Watts Up With That for the image of the election season

One thing the Wikileaks emails from John Podesta clearly show is that Hillary takes positions to get elected. Outside her need to be POTUS, she has nothing but a facade for her “public face”, and nothing but greed for her “private face”.

Take TPP, or the Trans-Pacific Partnership. This globalist cash-cow will do to America what NAFTA did: move many good American jobs overseas and force us to by more foreign made goods. One of the hits on Clinton is that she is a closet TPP supporter and is only pretending to oppose it in order to get elected. That old two-faced thing again.

Trump has nailed her a few times about her flip-flops on NAFTA (North American Free Trade Agreement):

“She supported (the North American Free Trade Agreement), and she supported China’s entrance into the World Trade Organization — another one of her husband’s colossal mistakes. She supported the job-killing trade deal with South Korea. She supported the Trans-Pacific Partnership.”

This is largely accurate, but it’s worth noting that Clinton no longer supports NAFTA or TPP, nor is it clear that the South Korean deal is a job-killer.

But did Clinton REALLY change her support? One email suggests any change in position is complete theatrics. Let’s break this down:

 On Tuesday, October 6, 2015, Nikki Budzinski  <nbudzinski@hillaryclinton.com> wrote:

Hi Robby and John

I participated in the strategy meeting today around TPP and opposition roll out. I wanted to share with you my additional thoughts coming out of this meeting. First, I’m very glad HRC has gotten to the oppose position, this will be very helpful with mobilization on the ground and support within labor during and after this primary.

The timing question for the roll out came up and I am wanted you to know I voiced my support for waiting for disclosure of the full document before HRC states her opposition on the issue. Here is my reasoning:

It is a year ago, as Clinton heads into the primaries. She has decided to opposed TPP, but there are some issues on when to come out of the closet (so to speak). It is in the discussion of these issues we discover Hillary really is not opposing TPP on any policy grounds.  She just needs some cover for her public face flip-flop:

1. Waiting until she can say she’s reviewed the language in the agreement is consistent with where her position has been and why she’s waited this long to weigh in. We don’t have the language yet or much documentation to fall back that she will be able to credibly say she reviewed and then therefore weighed in on. If she weighs in now, without viewing the document, some in labor might wonder why she didn’t just say she opposed earlier? (Sander’s polling, blah, blah,) It might make her position appear more political then what they’ll accuse her of anyways.

Emphasis mine. Right out of the gate we see her decision to oppose TPP was political, and her cover story (that she reviewed the language in the legislation and realized she could not support) is complete fiction. She clearly decided before the language was finalized or public.

So why is she “pretending” to have read this mythical language and now opposes TPP? Her campaign needs ignorant/naive labor to support her and vote for her:

2. It will not make a significant difference in capitalizing politically with labor if we do this tomorrow or three weeks from now, as long as we get to opposition.

Since I am not a Hillary fan, her lying through her teeth is no skin off my back. But if you are part of the labor unions, you should have your head examined if you think Hillary is serious on TPP!

One response so far

Oct 15 2016

Obamacare’s Death Spiral Begins

While the news media shoot their Big Sleaze Guns in a clearly coordinated attempted to fix the POTUS election for Hillary (think there won’t be multiple opportunities for a massive round of law suites after this debacle???), the big news this year is the collapse of Obamacare and how millions of Americans ARE LOSING their un-affordable health insurance. While the news media runs the gutter trolling for trash on Trump, Americans are really hurting, and hurting in serious numbers:

A new report from Bloomberg provides an estimate for just how many Americans will be affected: “At least 1.4 million people in 32 states will lose the Obamacare plan they have now.”

The people impacted will still have access to health insurance, as well as government subsidies to help pay for their insurance, if they qualify. But in some parts of the country, Obamacare customers will have only one option for insurance next year, after insurers like Aetna and UnitedHealth abandon the marketplaces.

This impacts 32 states in terms of choice, but all states have had to shoulder the financial burden:

In 2008, the average employer-sponsored family plan cost a total of $12,680, with employees footing $3,354 of the bill, according to Kaiser data. By 2016, the cost of the average employer family plan was up to $18,142 for the year, with workers picking up $5,277 of the tab.

These increased costs for employers and employees alike may seem steep—up around 50% over the past eight years—but they could have risen far higher had the Affordable Care Act never passed.

The myth we would have the same or higher costs without Obamacare is idiotic.  It would defy logic to say extending care to 26 year old children from the parent’s plan, or to ban restrictions from preexisting conditions, or that everyone had to have the same overloaded plan would cost us zero dollars.

If that was the case, then we would not needed to force insurance companies to take on all these added expenses in the first place.

But note the 50% increase in cost over 8 years, because what you will see coming in 2017 is Obamacare becoming completely un-affordable.

Example 1, Illinois:

Blue Cross Blue Shield of Illinois, the most popular insurer on the state’s Obamacare exchange, is proposing increases ranging from 23 percent to 45 percent in premiums for its individual health-care plans, according to proposed 2017 premiums that were made public Monday. The insurer blamed the sought-after hikes mainly on changes in the costs of medical services.

That one year jump rivals the increases from the last 8 years!

Examples 2 – 5, Oklahoma, Tennessee, Minnesota, Colorado, Arizona:

Among the states with the biggest 2016 premium hikes for popular low-cost “silver” plans, according to USA Today: Oklahoma rates are set to climb a whopping 42%; Tennessee is expecting a jump of 39%; and Minnesota, Colorado and Arizona, which should all see increases in the neighborhood of 25%

And now we learn North Carolina insurance market under Obamacare is on the verge of total collapse:

More than 250,000 people in North Carolina are losing the health plans they bought under the Affordable Care Act because two of the three insurers are dropping out — a stark example of the disruption roiling marketplaces in many parts of the country.

This Hot Air post references another post outlining the enormous costs families in Minnesota are facing:

Minnesota House speaker Kurt Daudt told me about a local farming family of three that has to pay $2300 a month in premiums for 2016 for a policy with a $13,000 deductible. That’s $40,000 out of pocket before the first benefit outside of a standard wellness check (~$500 per person tops) gets covered. For some reason, they stuck with the insurance this year, but Minnesota’s rates will be going up 50-67% in 2017. On the low end, that’ll make their premiums $3450 a month, which escalates that threshold to over $54,000 with premiums and deductibles added together. That’s more than some hospitalizations would cost, so … why would they stay in the exchanges?

As noted in the post, you can buy a really nice house for those premiums.

Or, you cannot afford to buy a nice house BECAUSE of those premiums. So I am not surprised the housing market is being hit by the fact people cannot afford a new or higher mortgage? Not in the least, take California:

August was the sixth consecutive month in which there was a year-over-year decline, even though sales remained above a rate of 400,000 for the fifth straight month.

“We are seeing the market tempering, which is being driven by reduced affordability and not enough homes for sale on the market, particularly in the San Francisco Bay regions, where runaway home prices have constrained home sales,” CAR President Pat “Ziggy” Zicarelli said in a news release.

“Two of the region’s least affordable counties — Marin and Santa Clara — saw sales fall from a year ago, while Contra Costa and Sonoma counties experienced more modest slowdowns.”

With Obamacare costs spiraling out of control – but mandated by law to be purchased – the cancer that is Obamacare is killing our economy and our future:

We don’t have to look far for confirmation that Americans are generally poor savers. Every month the St. Louis Federal Reserve releases data on personal household savings rates. In July 2016, the personal savings rate was just 5.7%. Comparatively, personal savings rates in the U.S. 50 years ago were double where they are today, and nearly all developed countries have a higher personal savings rate than the United States. In other words, Americans are saving less of their income than they should be — the recommendation is to save between 10% and 15% of your annual income — and they’re being forced to do more with less in terms of investing.

Is it a coincidence that the size of government over the last 50 years has ballooned (along with out national debt) and there was also a drop in savings? I am going to wager the statistical linkage is quite high here.

The article (from the politically driven news media) implies this is a problem with spend-happy citizens.  But I argue this is was brought on by spend-happy government, which claims it knows how to spend our income better than we do.  And let me be clear, this is our income over a life time of work, plus our children’s life time of income, and our grandchildren’s life time of income (given the stunning size of the national debt). This is not going to be cleaned up in a year, but we do need to stop the bleeding now.

Obamacare is destroying Main Street’s finances.  The super rich will not be seriously impacted by this mess, but the vast majority of the voters will.  There are two paths out of this mess:

  1. Become slaves to the government and the super rich and live off government handouts (gleaned from taxes on our hard work), or
  2. Prune government back down to minimal intervention towards Main Street.

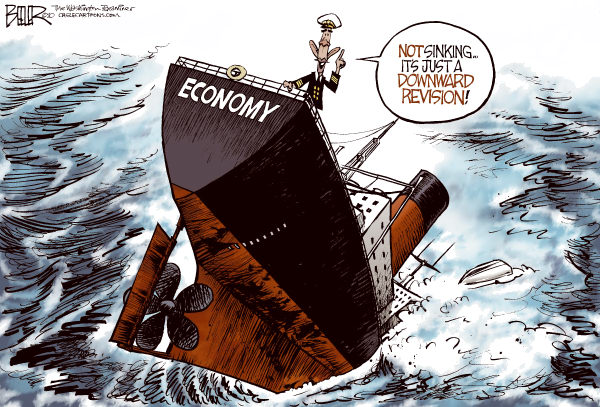
Obama did not lift all boats, he sunk them all.  And Hillary wants to do more of the same
One response so far

« Newer Entries - Older Entries »