Nov 30 2009
More Evidence CRU Has Raw Temp Data & It Shows No AGW
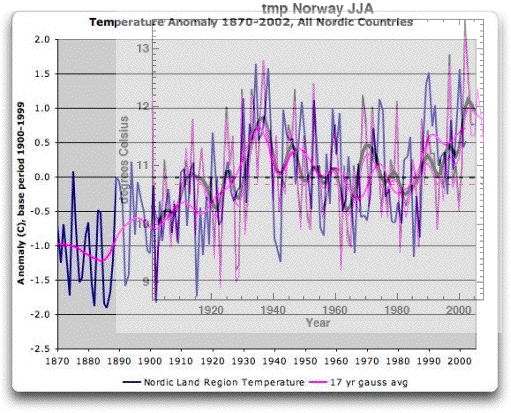
There is another example out of raw temp measurement data not matching the CRU/IPCC alarmist’s graphs showing dramatic recent increases and much cooler periods prior to 1960. This time the hard evidence comes from Norway, as noted at WUWT. Graphically we see another case of raw temp data – which looks fairly benign:
Now looking quite frightening once unproven ‘corrections’ or ‘adjustments’ have been made by AGW alarmists to create this:
What is interesting is how familiar that raw temp data looked to the file I discovered in the CRU data dump called idl_cruts3_2005_vs_2008b. I am still trying to confirm the data in this file (generated in July 2009 using 2008 data) does indeed represent the raw temp data CRU uses prior to adding in all those inaccurate proxies (e.g., tree rings) to create the AGW curve we see above.
So I decided to do a little experiment. I overlaid one of the CRU Norway graphs (JJA) on the raw data graph above and was pleasantly surprised to see a pretty good match (click to enlarge):
Looks damn close to me (track the black CRU trend line with the Purple line). I do need to note this is just one of four graphs from CRU for Norway, each covering a different quarter. I am not surprised or concerned it does not line up exactly – it shouldn’t. If you overlay all the graphs it gets too messy to make sense, but they do all tend to line up individually. This gives me more confidence that:
- The analysis I did on the CRU raw data is valid
- CRU did have the raw data as late as 2008, and possibly into 2009 (which makes sense)
- We do have raw CRU data to evaluate CRU, IPCC, and GISS against
I suspect as we do a country by country comparison we will find the same result I did – that majority of the planet has not seen significant warming in the last half century (post 1960) when compared to the half century before that. Which means the fears of global warming are based on unfounded statistics – i.e., at best an invalid hypothesis, at worst snake oil


These people have set back the cause reducing pollution by decades.
What a bunch of frauds.
What a bunch of criminals
Grapes were being raised for wine in England during one of those “overlooked” warm periods. The little ice age (cold, low food, high disease) killed people.
The earth would need to warm up some more to get back to where it has already been.
As with any other scandal we can find the truth by following the money.
This whole thing is a major exercise in semantics.
The problem here is to understand exactly what they mean by “homogenized” ?
If it means that they put it in a new form but did not modify the data with “adjustments” then the “raw data” still exists, but as was seen in New Zealand, the data was adjusted in some way, the new “raw data” isn’t the same as the original “raw data.”
One of the e-mails comments on how NASA GISS adjusts their data for urban heat island based on satellite light measurements, which the sender thought was done poorly.
Only time will tell.
[…] CRU data dump is actually the CRU global temperatures prior to all those AGW ‘corrections (see here), I want to focus in on one country that would be the perfect ‘canary in a coal mine’ […]
[…] I had the chance to test this theory recently in another post. Using raw temperature data from the Nordic regions of Europe I overlaid one of the CRU graphs from the 2005_2008b file (from Norway) and I got a very good  match: […]
[…] More Evidence CRU Has Raw Temp Data & It Shows No AGW […]
[…] from that region of Europe noting how the raw data does not line up with CRU and IPCC graphs (see here for one example). What is stunning about this letter (original here) is how Jones clearly is trying […]