Dec 10 2009
How Not To Create A Historic Global Temp Index
I was having this minor debate on the fallacies of alarmists’ science in the comment section of Air Vent and decided I needed to post on this because the infant climate science (and it is in its infancy) is making some fundamental mistakes.
The momentum that built up behind the man-made global warming fad (and it is nothing more than an unproven hypothesis surrounded by a silly fan club) has not allowed the basic approach to be tested or challenged. You had a movement build up around an idea, which launched the idea into ‘established fact’ before the idea was validated. It probably will never be validated because the methodology is flawed to its core – as I will explain in painful detail.
To create a global temperature index for the past 30 years – and then project that back to the 1880’s (when global temp records were began) and then project it back centuries before that – is not trivial. And in my opinion the current approach is just plain wrong.
I take this position as someone who works ‘in space’ – where we have complex and interrelated models of all sorts of physical processes. And yet we have to keep refining the models to fit the data to do what we do. Climate science naively (and ignorantly in my mind) does just the opposite; it keeps adjusting the data (for no good reason) until they get the result they want!
For this comparative exercise Al Gore, a genius in his own mind, provides the perfect analogy – gravity. Yes Al, it’s there. But we still can’t predict how a body will travel through the atmosphere or space to an accuracy that is stable beyond a few seconds (for the atmosphere) or days (for Earth orbits). Our window of certainty is not months, seasons, years, decades, centuries or millennia. And yet gravity is very well understood and simple mathematically.
Add to that the fact our measurement systems for space systems blow away those being used by alarmists, who claim a science fiction level of accuracy in measurement and prediction. Maybe that is why they have a cult following instead of scientific proof?
In Earth’s orbit a satellite is pretty much free of atmosphere and can fly for 10-20 years. But it cannot keep its position (for GEO birds) or we cannot know its position (for GEO, MEO and LEO birds) without constantly taking measurements and correcting the models. (Sorry, geeked out there for a moment: LEO = Low Earth Orbit, MEO = Mid Earth Orbit, GEO = Geosynchronous Earth Orbit (stays above one spot on Earth, very high altitude).
While gravity is well understood, it is not the only factor working on the satellite’s flight path. After nearly half a century of exploring space we have unraveled some of the factors (sunshine pushing on the satellite, heat escaping causing a small thrust, an atmosphere which expands and contracts daily and seasonally, solar flares, etc). We cannot accurately model these beyond a few days. After about 7 days these forces build up enough change in the orbit in completely random ways that we have to remeasure the orbit and compute another prediction.
Gravity is simple, but we cannot predict out beyond a week with any accuracy.
For satellite orbits it would make no sense at all to ‘adjust’ the data to fit a curve as the alarmists do for temperature. If a data point is bad it is either consumed inside a sea of good data points or rejected because we have a sea of good data points to use. If there are sufficient data points you don’t adjust the data – bottom line. Either you have enough data to draw a conclusion or you don’t. You don’t make up data to fill your need either.
If the rocket scientists can only predict the path of an object orbiting the globe for 7 days, what sane person thinks a hodge-podge of randomly accurate and aging sensors around the globe can measure a global index, let alone predict the future or unravel the past? It cannot. But what ‘scientists’ do to the data to pretend they can is downright silly.
They make adjustments or homogenizing stations or fill in grids with pretend stations. A total unscientific joke. The measurement is the measurement. It has a fixed accuracy and uncertainty. Each station has a unique accuracy and uncertainty due to its siting, technology and the accuracy with which its readings are made each day. (geeked out again: if there is a drift in time when you read the sensor, or that sensor’s reference to UTC (the world wide time reference) is unknown or dynamic, then you increase the error bars to the measurement). If the sensor is sited wrong or has problems you extend the error bars. You DON”T adjust the data!
(Sorry, geeked out again. Error bars are the range in which the real world value could be. If I measure an orbit to a accuracy of +/- 50 meters, then I know what ever number comes out of my system is not real. Reality is in that 100 meter range around the value. Statistically all I know is the satellite is in that range, the value I compute only centers the box it can be found in.)
You cannot adjust data to remove error or increase accuracy on a single sensor! If you do a regular regime of calibrating the sensor against a known source, you can remove BIAS. But that is all. What we do with sensor nets when we combine them is we can remove some error by comparing measurements that overlap in time and space. But that again something totally different than what the global scientists think they are doing.
Another example: moving stations. When a temperature station is moved it should simply become a new station at that point in time, with a new set of siting errors (and accuracy if the sensor is upgraded). It has a different time window than it previous incarnation – it is a new data set. When I see crap like this I realize these people are just not up to this kind of complex analysis.
Before:
After:
You don’t ‘homogenize’ neighboring stations into a mythical (and fictional) virtual station. That is just clueless! And there is no need to. Â When that happens start a new data set. Those stations measured real temperatures, as shown in the top graph. They are three independent data sets with fixed attributes for the locale. Whatever that mess is in the bottom graph, it is nothing more than shoddy modelng. It destroys the historic record and replaces it with someone’s poor mathematical skills or scientific understanding.
I mean think of what that graph says in my world. If I had measurements of the moon’s position in the night sky from these three points I could reproduce the Moon’s orbit. But what happens in that second ‘adjusted’ graph is silly. I would be changing the measured position of the Moon for two ‘adjusted’ stations to make it closer to the first station – while not moving the two stations physically! They would produce a lunar vector similar to the others, but did I really move the Moon? Of course not, all I did was insert a lot of error. Now my calculation on the Moon’s position over that period does not reflect reality (or the established gravitational model). The question is, does it fit someone’s half cocked new theory of gravity – yet unproven!
Basically what alarmists needed to do was not adjust data, they needed to create a thermal atmosphere model which would take into account siting characteristics both local and large. This would include distance from large bodies of water, altitude, latitude, etc. A three dimensional model that would explain why various stations have their unique siting profiles and temperature records. It would explain why temperatures near oceans fluctuate less than stations inland 100-200 miles. It would show how a global average increase of 1°C would result in a .6°C increase at high latitudes or altitudes. It would EXPLAIN the data variations in the measurements.
But we don’t have this model. Alarmists cannot explain with accuracy why stations 10 miles apart show different temperature profiles each and every day of the year. So they pretend to know how to ‘adjust’ the data and their groupies applaud them for their brilliance. Yet the result, like my Moon example, is they simply lost site of reality.
Another irresponsible gimmick is creating mythical stations in grids without measurements. As we all know the temperature for a town or city 20 miles away can be totally different than that for our home town. Just bring up a local weather map. As weather fronts move through the dynamics over a region are dramatic. These changes happen all year at any time of day. 20 miles down the road things can be totally different.
Yet the CRU and others create fictional stations 750 kilometers away from the nearest data point – as if that makes any sense at all. There is no data in these regions – don’t make up data and call it truth! No data means no measurement.
In my world we can interpolate a trend forward to fill measurement gaps. For example we don’t measure each point on the orbit, we measure a couple of times a day to get a set of points on the orbit from which we can derive an accurate orbit curve. Because gravity is so damn simple we have incredibly high confidence in those computed positions in the measurement gaps. But as I said, they decay over time (5-7 days). If we don’t remeasure, the errors increase with time.
Global Climate is nowhere near as simple as gravity. It decays over distance and time rapidly, just as ballistic flight through the atmosphere is unpredictable over distance and time, no matter how predictable gravity is. If they wanted to validate that 3-D model I proposed, they would predict temperatures in regions without measurements and then go measure them to see if their model was right. You don’t mix models and raw data – that is just wrong (though that is the essence of Michael Mann’s “Nature Trick”).
Another disturbing problem with climate science is identification of error and uncertainty. In the alarmists’ world there is no degradation over distance or time – which makes their results pure science fiction. If they had a reviewed, verified and defendable error budget they could move from fiction to science. They would also understand why their conclusions are standing on seriously shaky ground.
OK, going full geek here. An error budget shows how much error is added to the final computed number at each stage of its processing from the base measurement. For the global warming problem this budget covers the point of a temperature measurement at a station to the point a global annual index is derived, and it must contain the following error steps:
- Measurement error: all the errors associated with taking the raw measurement. This includes the sensor accuracy and biases (if unknown or measured these become noise), siting induced errors, time of measurement induced errors (one must take the measurement the same time every day to within a certain tolerance to create a consistent historic or annual record).
- Local geographic error: A sensor measurement like temperature is only good for a certain distance. The farther you move from it the more the accuracy degrades as the error increases. No one has demonstrated the distance a single station’s measurement can be considered valid. At this stage we have a raw station temperature set from specified times of day.
- Station integration error: when you take data from two or more stations to create a regional index, you must integrate the first two error sources described above and carry that to the integrated station level for a region or grid. In some systems combining sensors can increase accuracy. Land temperature sensor nets are not one of those kinds of systems. There are too many factors due to siting and distance (the temp decay problem) to increase accuracy. To do that you would need to have sensors located geographically close (under 5 miles I would estimate) to actually remove sensor and siting errors. At this stage we have a local regional data set (more than one station).
- Day-to-Month integration errors: Temperatures are taken daily at fixed times and then integrated to make a daytime and nigh time index. Â Then these daily indices are integrated into monthly indices. The error from the daily computations must then be integrated and added onto the monthly index.
- Month-to-year integration errors: The AGW alarmists need to create a historic record, so they look at a yearly index (CRU actually looks at the 4 seasons first, then integrates). What ever the methodology, there will be additional error introduced to create an annual index for a geographic region. At this stage we have a local regional data set per for a single year.
- Large geographic integration errors: Finally, you integrate mid sized regions from step 3 above into data sets for countries or hemispheres or the globe. Again, we are compounding the errors from the previous steps – some offset, some don’t. They all have to be accounted for – no hand waving!
Each local region going into step 3 has a very unique set of errors due to the unique nature of the errors defined in steps 1 & 2. From step 3 on you have a homogenized set of local regions, which have errors integrated in a consistent manner as we move from daily measurements to monthly and annual (steps 4 & 5). Finally we have a consistent method to capture additional errors as we integrate up to cover the globe (step 6).
A defendable error budget is an obvious requirement for any number spewed from any alarmists. Without it the numbers mean nothing. In my business we use these budgets to fly rockets (atmosphere) and spacecraft safely. We use them to understand when we need to remeasure and recompute a new predict. If space programs did not have a handle on this we could not fly through Al Gore’s gravity field and Earth’s atmosphere. The fact is, for launch and ascent and because the error in position can increase so quickly, we measure and adjust the guidance at incredible rates to make it into orbit safely.
We have to. We cannot adjust the data, we have to adjust to the data.
Now what I presented above is just the errors in making a measurement today for one year. What happens when you go back in time? Well you have to recompute the error budget for each station for each year. What you should see (if done correctly) is rapidly increasing error bars as the technological accuracy is lost as we go back in time. The errors in step 1 would start to increase by orders of magnitude.
But if you look at the silly claims of NCDC, GISS and CRU you see very small changes in uncertainty going back in time  – proof positive they screwed up their error budget. One of my first posts on Climategate was on errors in climate estimates over time, and I used space exploration again as the example.
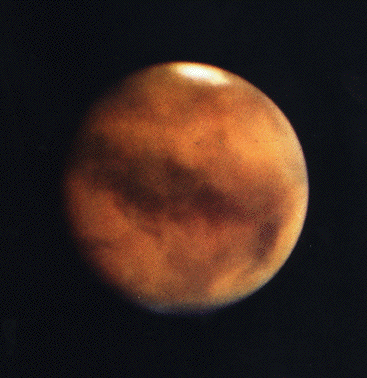
I used the accuracy know as ‘image resolution’ as the example everyone can relate to (more pixels more detail, less error or blur). I used two pictures of Mars to demonstrate the state-of-the-art capabilities of humankind separated by ~50 years. First was an image taken in 1956 from the Mt Wilson Observatory:
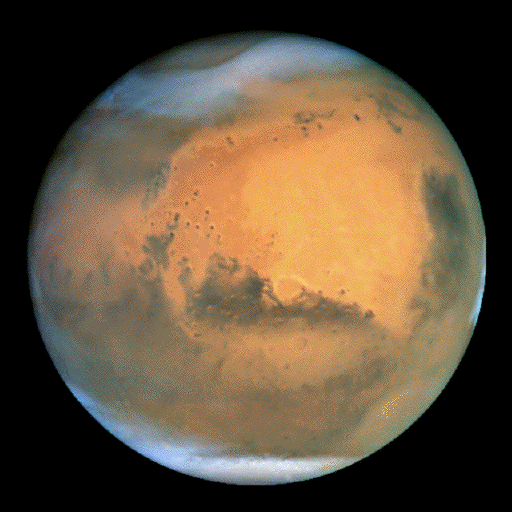
Second was taken by the Hubble Space Telescope in 2001.
We can all see the effect going back in time has on accuracy and error. In 1880, when the global  temperature record began, humans were drawing Mars not photographing it.
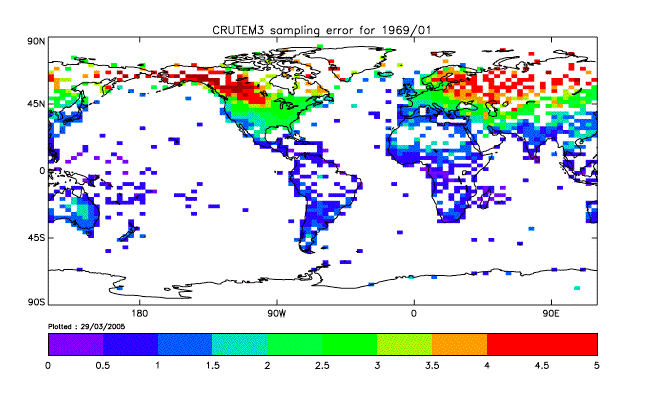
The CRU data dump made public a very interesting document. It was an early attempt at an error budget, though it does not show the steps, just their initial estimate of a bottom line. Also interestingly enough, they computed it for 1969. The following graph is from that document and proves (per CRU) that the current temperature reconstructions are way too imprecise to confirm the warming claims of the IPCC and other alarmists (click to enlarge):
The title of this graph indicates this is the CRU computed sampling (measurement) error in C for 1969. It clearly shows much of the global temperatures for 1969 are +/- 1°C or more. Which means that until our current temperature rises well above 1°C over that computed for 1969 we are statistically experiencing the same temps as back then. And we know these error estimates will have to grow as we go back another 80 years to the 1880’s, let alone even farther back in time.
I don’t even think the CRU estimates are right and complete, but I do know they alone disprove the IPCC claims that there has been 0.8°C rise in temperature over the last century, mostly due to human activities. The data cannot make that determination.
Prior to 1880 there are no real global temperature records, so scientists tried to find proxies. One good proxy is ice cores, which capture the chemical composition of the snow and ice going back thousands and thousands of years. Chemical signatures are very accurately tied to temperature since these are physical processes. No surprise but the ice cores show no significant warming today. Instead, these ice cores show many warmer periods in the history of humankind. Update: WUWT has more ice core perspective. – end update
Therefore Mann and Jones and other alarmists went to a much less reliable measure of historic temperature – tree rings. Tree rings are effected by a lot of factors, the least of which is temperature (after a certain minimum has been attained to activate is growth processes). Tree growth depends on sunshine, nutrients, water and number days above the optimal temperature. A tree ring should show the same growth under 30 days of 40°F temps with plenty of moisture (afternoon showers) and nutrients as it would under 30 days of 55°F temps and the same conditions. Trees are not thermometers.
Using a living organism to measure temperature is dodgy compared to the physics of chemistry used with ice cores. The error bars on a tree ring mapped to a temperature range (and it can only be mapped to a range, not a value) are huge. But the alarmists don’t do proper science, they run statistics until they get the answer they like, then throw out the error bars as if they are meaningless. There is no way for trees rings to define any historic temperature value. Therefore claims that the MPW or Roman Period were a degree or two warmer or colder using trees is all bunk.
This post is too long and too geeky already, but I need to note that there are few people in the world capable of discerning which scientific argument is more sound. No journalist or politician can discern whether I am right or wrong. Al, give it up baby. You did not invent the internet (I know those who did) and you have a 3rd grade grasp of science (and I have two 4th graders who can prove it). I suggest you stay away from any debates outside talking to journalists. They never know when you drop one of your classic whoppers of ignorance.
The sad fact is the science behind man-made global warming is not good science. It is rather pathetic actually. I work with premier scientists and in fact review their missions for feasibility to return the results advertised. I would fail this mess without a second thought.
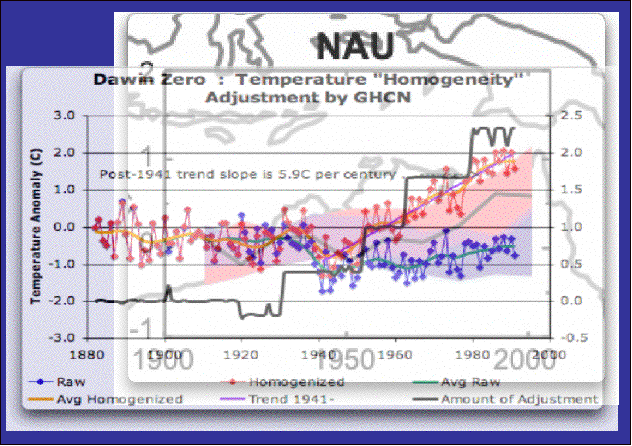
In addition, you cannot leave the verification of man-made global warming (AGW) in the hands of those whose careers and credibility rest on AGW being proven to be true. When you do, you get those questionable ‘adjustments’ that turn raw temp data (processed to at least step 5 in the error budget above) into something completely different. For example, here is my version of a classic graph now making its rounds on the internet (click to enlarge):
What is shows by the blue dots and lines is the raw temperature data for Northern Australia. This overlays perfectly with what the UN IPCCs Global Climate Models predict would be the temperature record for the region without AGW (the blue region in the underlying graph. The red dots and lines are what is produced from alarmists’ ‘adjustments”, and unsurprisingly these line up with the Global Climate Models predictions if there is AGW (reddish region).
Alarmists adjust temp data that magically proves alarmists’ theories, based on alarmists’ models. Impressed? I’m not. I tend more towards disgusted.
The science of global warming is a mess. They have no error budget that proves they can detect the warming they say they have detected. Their tree data is applied wrong by assuming a temp value when all you can estimate is a range (and tree ring recent divergence with current temps just proves trees are lousy indicators of temperature anyway). The alarmists have made all sorts of bogus and indefensible site adjustments, station combing while regularly making up stations from thin air to alter (or hide) the real temperature record.
Instead of explaining the data, they adjust the data to meet their explanations. The Global Climate research has not made it to a professional level of scientific endeavor as we see in more established areas of science.. If their science was so settled the supporters could answer these challenges without lifting a finger. But they cannot, instead they play PR games and smear their opponents. Houston, they have a problem.


The Climate “Scientists” came out very badly. In the discussion. The engineers were totally dismissive.
[…] use the same ‘methodology’ to measure the Moon’s orbit from these 3 locations (something I alluded to in this post). We are going to take a measurement of the Moon’s position from all three sites (as shown in […]
[…] mentioned the document months ago in this post (and others) as evidence that the CRU temperature data DOES NOT have the accuracy required to […]
Heh.
“# Paul_In_Houstonon 10 Dec 2009 at 2:28 pm
…
Just the perversity of the universe; the same one that makes the typo glaringly obvious just after you hit the “Submit Comment†button.
…
random typographical errors, just to releive …”
My enquiring mind has to know: did you spot the misspell of “relieve” just after you hit Submit Comment?